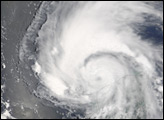
With the arrival of Hurricane Emily, the second major hurricane in the month of July, the 2005 hurricane season has gotten off to an unbelievably fast start. Already the record 5th named storm of the season by mid-July, Emily made landfall in Mexico as a major hurricane two separate times: first in the Yucatan Peninsula as a Category 4 storm and again in Tamaulip as along the northeast coast just south of the Texas border as a Category 3 storm.
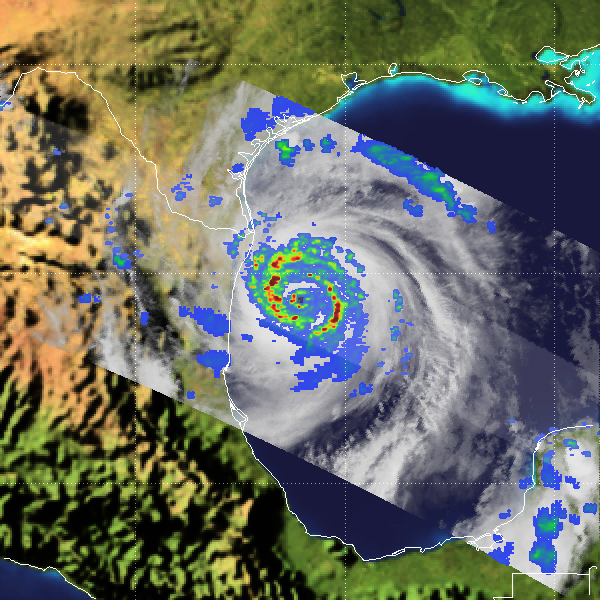
These images show Emily as it was moving ashore for the second time on July 19 and July 20, 2005. Both images were captured by the Tropical Rainfall Measuring Mission (TRMM) satellite and show rain intensity within the storm. The lowest rain intensities are represented in blue, while the highest intensities are red.
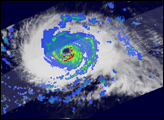
The top image was taken at 00:09 UTC on July 20, (7:09 p.m. CDT) as Emily was nearing the northeast coast of Mexico. By this time, Emily’s winds were up to 110 knots (127 mph), according to the National Hurricane Center, making it a Category 3 hurricane. This image reveals that Emily was in the process of forming a double eyewall. Concentric green circles embedded with red areas of heavier rain surround the small eye. This observation was later verified by hurricane hunter aircraft and coastal radar. A double eyewall occurs in mature, intense hurricanes when an outer eyewall forms outside of the inner eyewall and eventually contracts and replaces the inner eyewall. The double eyewall is an indication that Emily was becoming more organized and more intense. However, Emily was already too close to land to become much stronger and came ashore on the northeast coast of Mexico about 75 miles south of Brownsville, Texas as a Category 3 storm.
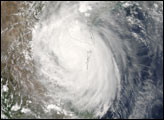
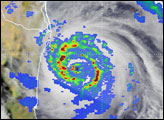
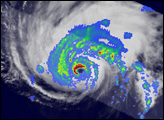
TRMM had captured the lower image of Emily less than seven hours earlier at 17:36 UTC (12:36 p.m. local time) on July 19, 2005, in the western Gulf of Mexico. The image provides further evidence that Emily was strengthening before coming ashore. A well-defined eye is clearly visible with intense rain all throughout the northern half of the eye-wall (red semicircle). The surrounding rain bands are tightly curved (green circular features) with areas of embedded heavy rain (red areas).
The intense rain visible in the center of the storm in this image is a good indication the Emily was still strengthening. As water vapor condenses into the cloud droplets that produce rain, heat is released. This heat, known as latent heat, is what drives the storm’s circulation. It is most effective when it is released near the core of the storm as is the case here with Emily. At this time, Emily was a strong Category 1 hurricane with sustained winds reported at 95 mph by the National Hurricane Center (NHC).
In both of the above images, rain rates in the center part of the swath are from the TRMM Precipitation Radar (PR), the only radar capable of measuring precipitation from space. Rain rates in the outer swath are from the TRMM Microwave Imager (TMI). The rain rates are overlaid on infrared (IR) data from the TRMM Visible Infrared Scanner (VIRS). TRMM is a joint mission between NASA and the Japanese space agency JAXA.
Images produced by Hal Pierce (SSAI/NASA GSFC) and caption by Steve Lang (SSAI/NASA GSFC).


