The Earth Observatory has published its last Image of the Day on this website. Please join us on our new home at science.nasa.gov/earth/earth-observatory.

The EO is moving! Join us at science.nasa.gov/earth/earth-observatory
Published Dec 2, 2025
In late September 2025, a continued lack of rainfall led to stunted vegetation, lowered water levels, and prompted early fall foliage.
Published Sep 26, 2025
Fires burning in boreal forests created hazy skies across North America in summer 2025.
Published Aug 5, 2025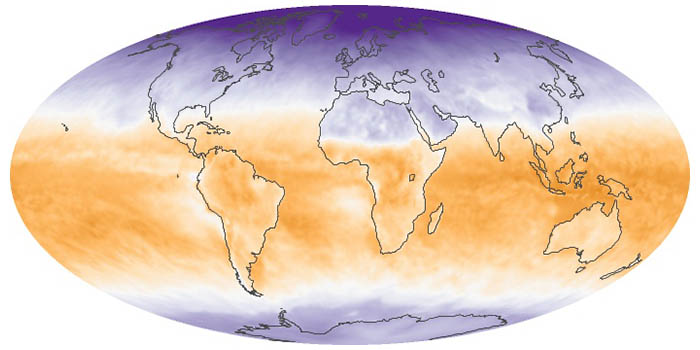
Net radiation is the balance between incoming and outgoing energy at the top of the atmosphere. It is the total energy available to influence climate after light and heat are reflected, absorbed, or emitted by clouds and land.
Jul 2006 — Jul 2025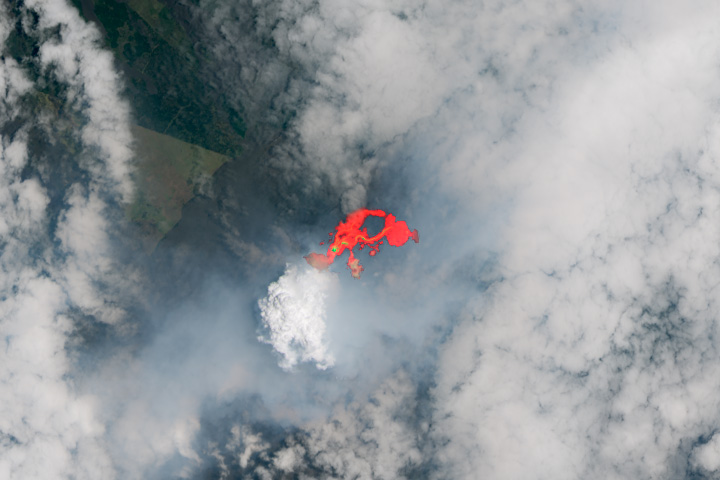
The latest in a string of episodic eruptions produced voluminous fiery flows at the Hawaiian volcano’s summit.
Published Jul 24, 2025