If the Greenland Ice Sheet were to melt completely, mean global sea level would rise by about 23 feet (7.2 meters). It is no wonder that scientists are eager to refine estimates of how much, and how fast, melting will happen over the coming decades and centuries.
But ice is also being lost from glaciers close to, but separate from, the ice sheet, and the impact is likely to be more immediate. Until recently, losses from these “peripheral glaciers” were often discounted. Recent research suggests they should not be.
Peripheral glaciers are exceptionally sensitive to climate change. On one hand, they are the site of more frequent storms that bring extreme snowfall. On the other hand, they exist at lower elevations where they are more susceptible to warming air and water temperatures.
“Mass loss from Greenland’s peripheral glaciers is often ignored because their contribution is small compared to the ice sheet,” said Shfaqat Khan, a climate scientist at the Technical University of Denmark and lead author of the new study. “In recent years, temperatures in the Arctic have increased, so we decided to investigate whether mass loss from Greenland’s peripheral glaciers has increased and by how much.”
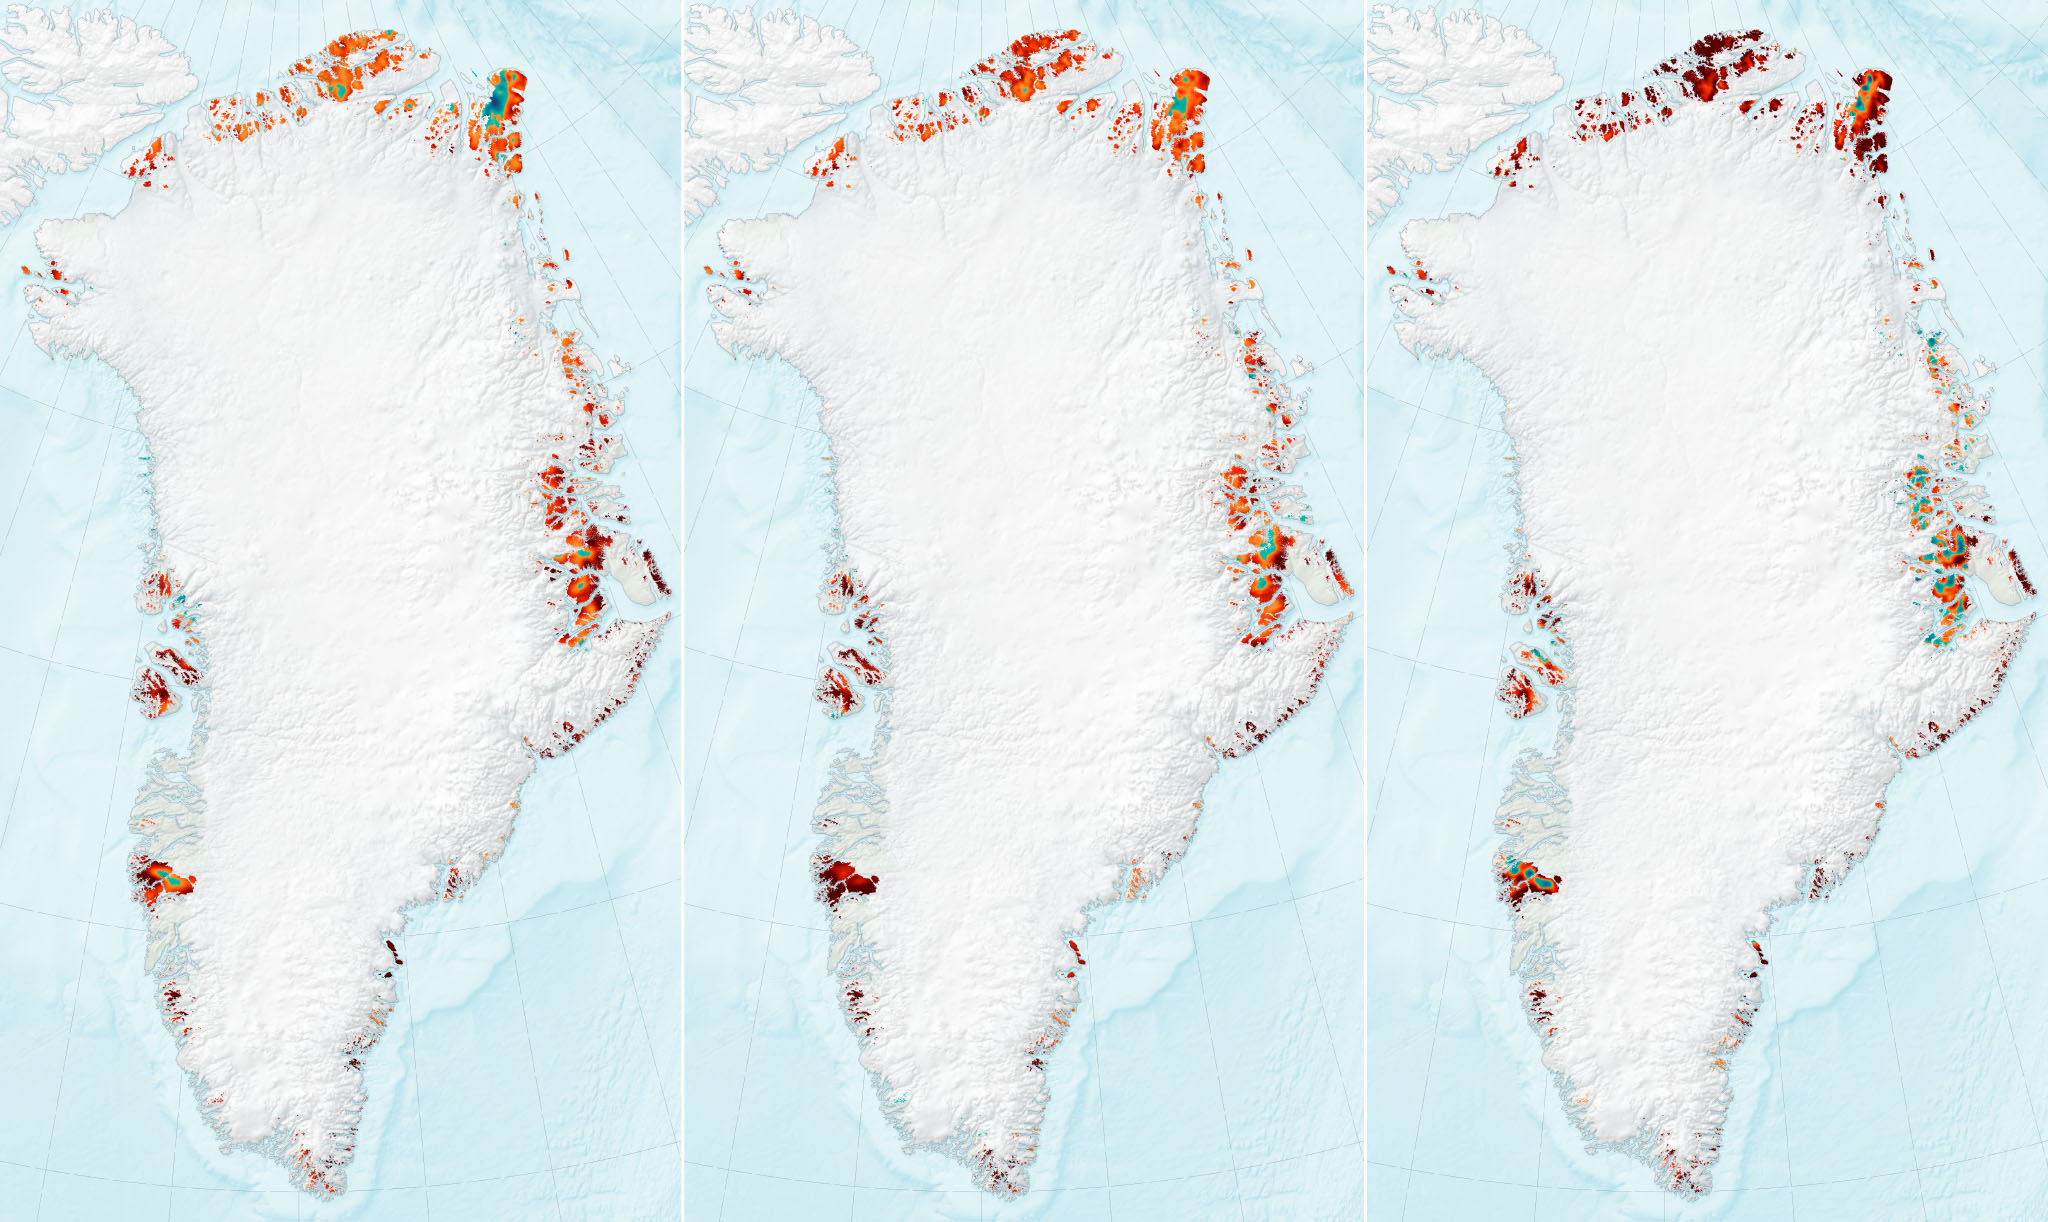
Khan and colleagues used laser altimetry data from NASA’s Ice, Cloud and land Elevation Satellite (ICESat) and ICESat-2 to show how the height of Greenland’s ice surfaces changed between 2003 and 2021. Measurements of ice height can then be used to determine the thickness and volume of the ice, which is then converted into mass.
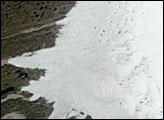
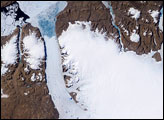
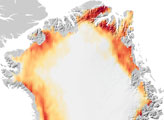
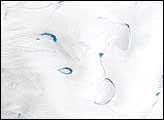
The maps on this page show where peripheral glaciers have thickened (blue) and thinned (red). The first map is based on data collected by ICESat from 2003–2009; the third map is based on data from ICESat-2 (2018–2021). The middle map (2008–2019) was estimated based on the last and first years of data from the ICESat and ICESat-2 missions, respectively.
Results show that ice losses are accelerating. Across Greenland, peripheral glaciers were losing 27.2 billion metric tons of ice per year from 2003–2009; by 2018–2021, they were losing 42.3 billion metric tons per year. The changes across the island nation vary, and the detailed maps show where losses have been the largest.
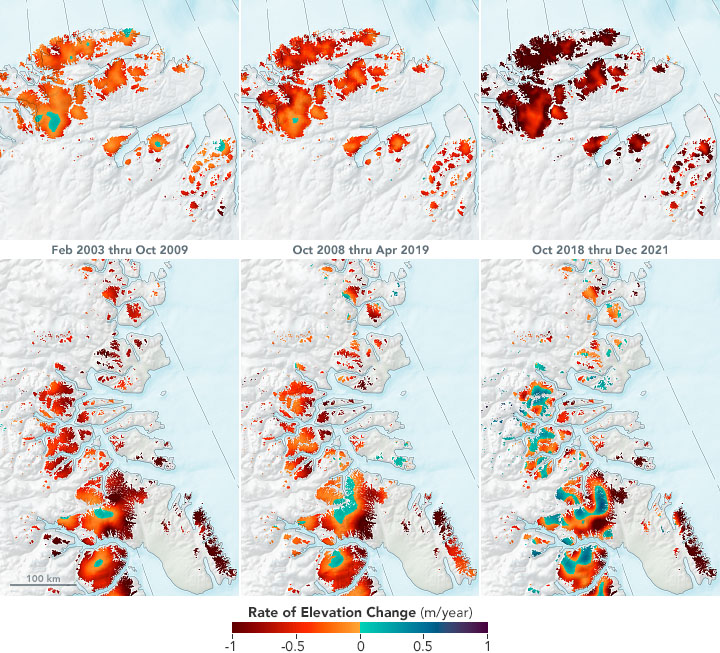
In north Greenland (top row), thinning was widespread in 2003–2009, but there were small patches of thickening at the highest elevations. By the later years of the study, even the highest elevations were losing ice. According to Khan, mass loss in north Greenland has increased four-fold over the satellite observation period, and the region has contributed about 10 percent of Greenland’s total ice loss.
In northeast Greenland (bottom row), the changes were more complex. Gains in snowfall in the upper portions of the glaciers mitigated some of the losses. But Brooke Medley, a glaciologist at NASA’s Goddard Space Flight Center (not affiliated with the study), pointed out that losses are still outpacing gains. Unless the region sees more large, moisture-rich storms or cooler temperatures, snowfall might only help slow down their ultimate demise.
“In order to understand how these ice masses change now and into the future, we need to observe their evolution through time and build better models of their behavior,” Medley said. “This will ultimately improve our predictions of future sea level rise.”
NASA Earth Observatory images by Joshua Stevens, using data courtesy of Khan, S. A., et al. (2022). Story by Kathryn Hansen.