James Lea spends a lot of time looking at satellite imagery, particularly of cold places. In recent years, the glaciologist from the University of Liverpool has been examining images of the Greenland ice sheet and its edges, cataloging melt ponds—when they form, how large they grow, when they drain. It is painstaking but important work, and Lea and colleague Stephen Brough often turn to computers to sort through the volume of images.
But sometimes the human eye overcomes the artificial one. In October 2020, Lea found a gem while looking through some older imagery. “Doing a lot of tedious manual checking currently, but definitely helps when you come across absolute stunners of images like this one,” he tweeted to colleagues.
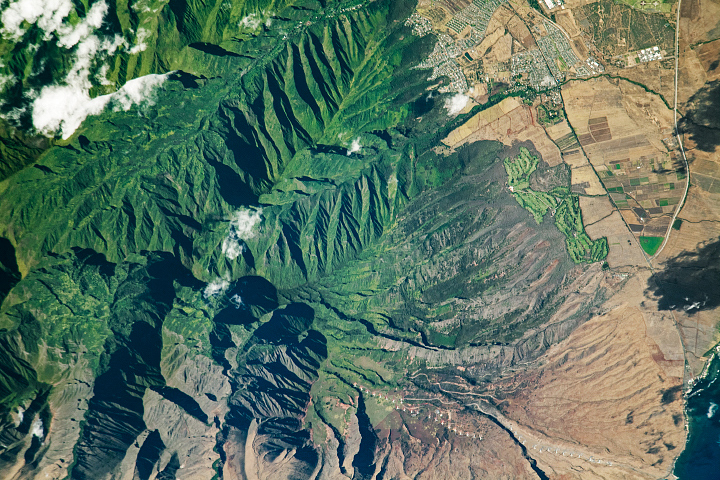
On July 30, 2019, the Operational Land Imager (OLI) on Landsat 8 acquired a natural-color image (top) of glaciers and mountains in eastern Greenland, just inland from the coast. Mountain peaks cast long shadows in the early evening sunlight. In the second image, the natural-color Landsat 8 data was draped over a global digital elevation model to capture the topography of the area. The area shown in the images lies a bit northeast of Gunnbjørn Fjeld, the tallest mountain in Greenland. The region is dotted with nunataks—rocky peaks that stick through glaciers and ice sheets—in the Watkins Range, Greenland’s tallest mountain range.
Lea and Brough typically view the icy surfaces of Greenland with the Moderate Resolution Imaging Spectroradiometer (MODIS) instruments on NASA’s Aqua and Terra satellites, which get twice-daily views of the island at a resolution of roughly 250 meters per pixel. Using the computing power of Google Earth Engine, they track melt ponds—pools and lakes of freshwater that accumulates on top of the ice in the warm summer sunlight. Scientists are keenly interested in the evolution of those ponds because they often leak to the bottom of the ice, draining to the ocean (affecting sea level) and lubricating the motion of glaciers as they flow downslope.
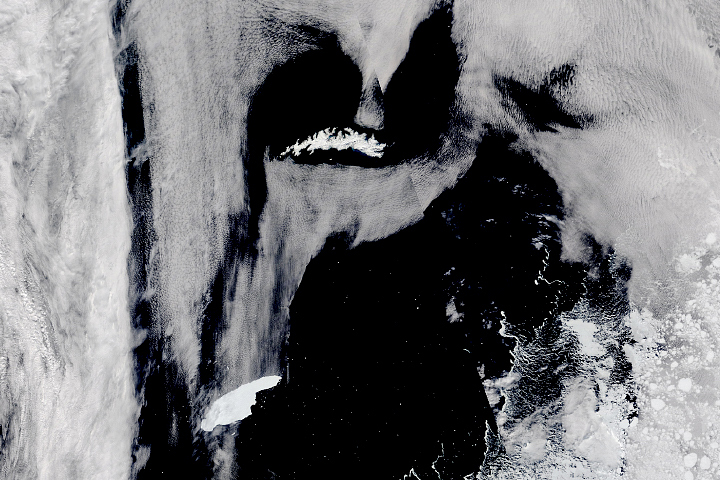
Because the area observed by MODIS is so broad, Lea periodically cross-checks his melt-pond detections against Landsat images, which are acquired less often but with much higher resolution (15 to 30 meters per pixel). For comparison, here is a MODIS view from the next morning, showing the same region as the Landsat image. Both were acquired while Greenland was in the midst of a widespread heatwave that caused melting across 90 percent of the ice sheet.
“With the resolution of Landsat 8, we can validate whether lakes that may be only a couple of pixels in MODIS are actually lakes or whether they are shadows, ice debris, or nunataks,” Lea said. In the image above, “the low Sun angle allows us to see a worst-case equivalent of what the daily MODIS image mosaic shows. In high Sun-angle images, shadows cover a much smaller area. But given that the MODIS composite could be made up of multiple images taken at different Sun angles, this can create an issue with false positives. Looking at the low Sun-angle images is one of many validation steps we have undertaken with the data.”
In a recent study, Lea and colleagues showed that melt ponds can now be found at higher elevations than just a few years ago, a result of ever-warming air temperatures and other changes in the Arctic. Examining 20 years of MODIS data, Lea and Brough have found significant increases in meltwater lakes in Greenland.
NASA Earth Observatory images by Joshua Stevens, using Landsat data from the U.S. Geological Survey and topographic data from NASA/METI/AIST/Japan Space Systems, and the U.S./Japan ASTER Science Team. Story by Michael Carlowicz.