A team of scientists led by John Worden of NASA’s Jet Propulsion Laboratory may have solved a puzzle involving a potent greenhouse gas. Atmospheric methane levels have been rising, so Worden and colleagues applied some new analyses of satellite and ground-based data to more accurately pinpoint the sources.
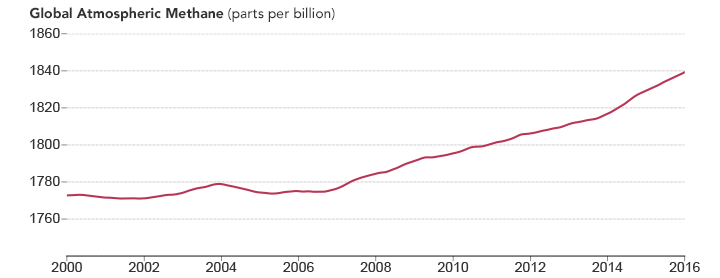
The concentration of methane in the atmosphere has risen sharply—by about 25 teragrams per year — since 2006. In recent years, different research teams have come up with viable but conflicting explanations for the increase.Some teams have published evidence showing that emissions from biogenic sources is driving the increase. Wetlands, ruminants, and rice paddies—all home to methane-producing microbes—are some of the major sources of biogenic methane.
Other teams have argued that a simultaneous increase in atmospheric ethane, a key component of natural gas, implies that fossil fuels are the culprit. Extracting and transporting fossil fuels add both ethane and methane to the atmosphere via leaks in wells, pipes, and other infrastructure.
In the new study, Worden and colleagues make the case that both fossil fuels and biogenic sources (wetlands and agriculture) are responsible for the increase. Worden’s team calculated that fossil fuels have contributed about 12 to 19 teragrams of methane to the atmosphere each year since 2006. They found biogenic sources contributed 12 to 16 teragrams per year. At the same time, emissions from biomass burning—wildfires and prescribed burning—decreased by 4 to 5 teragrams per year.
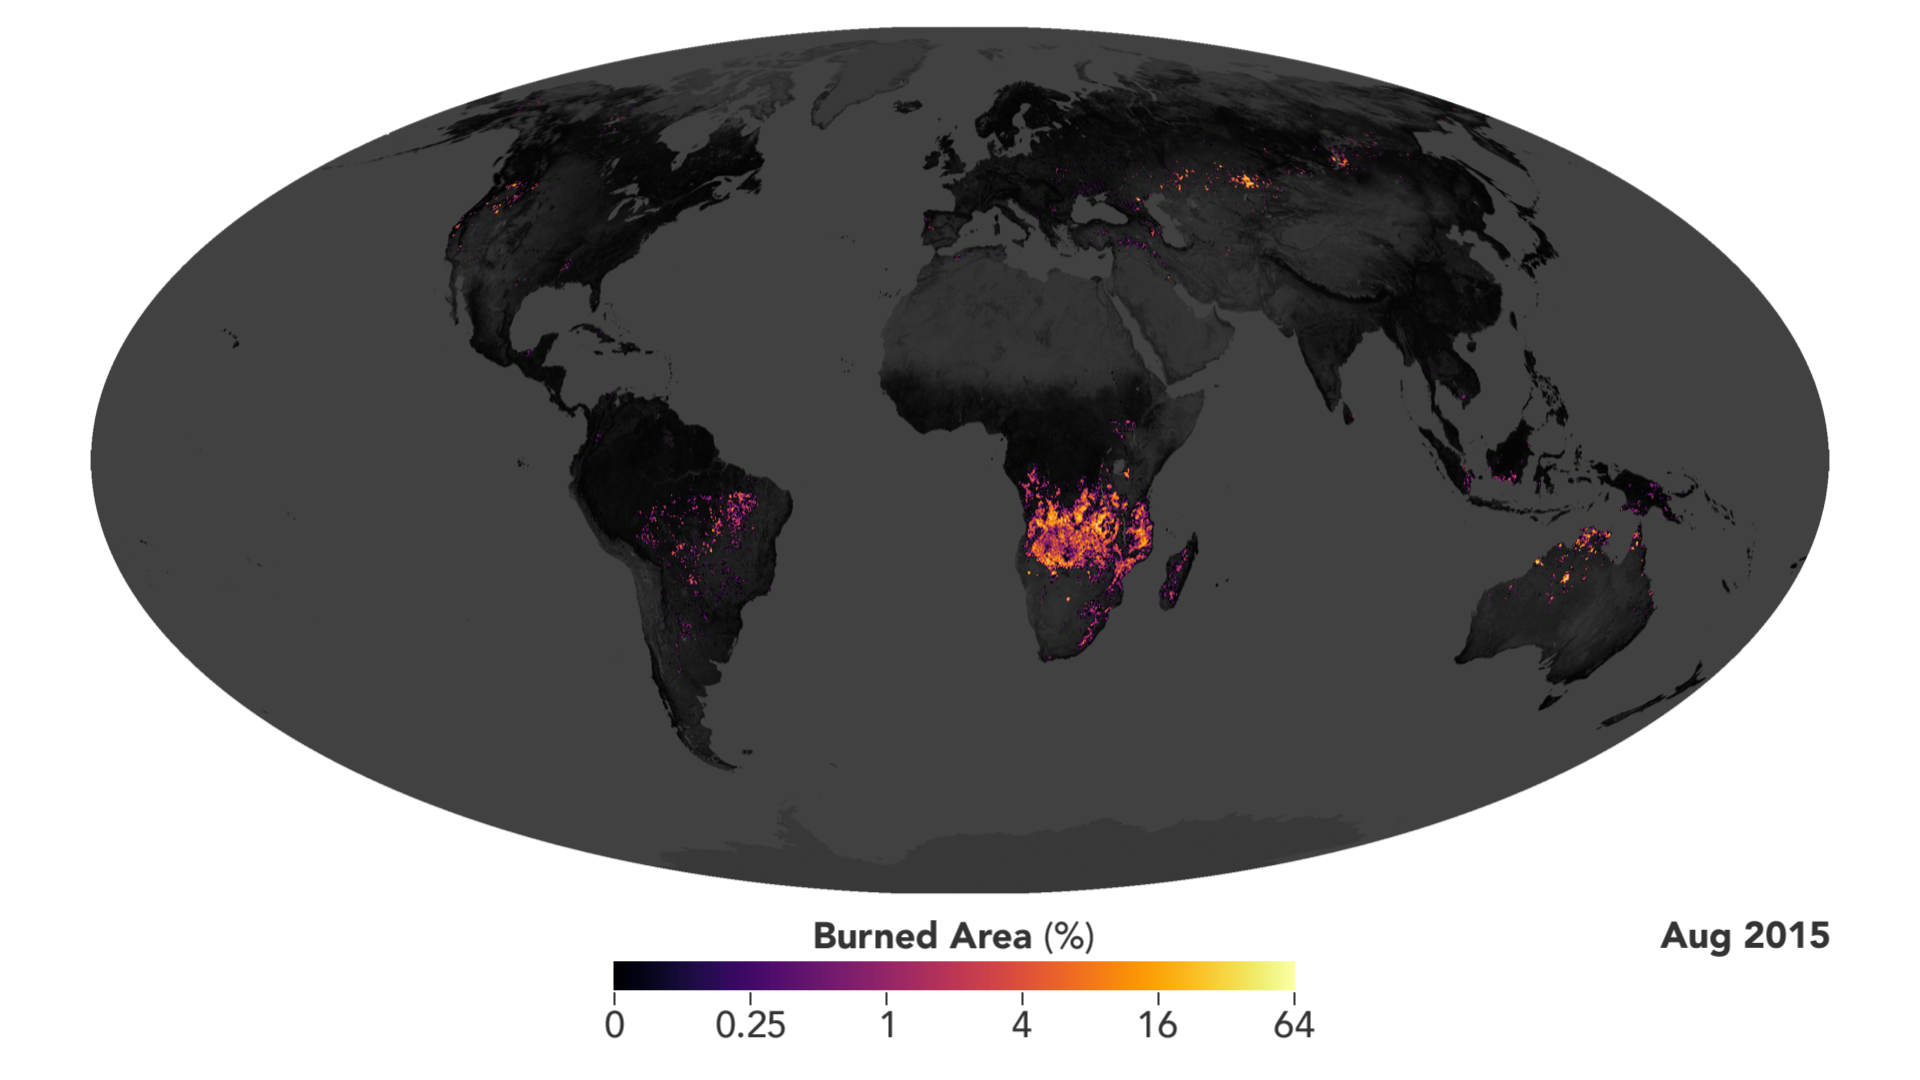
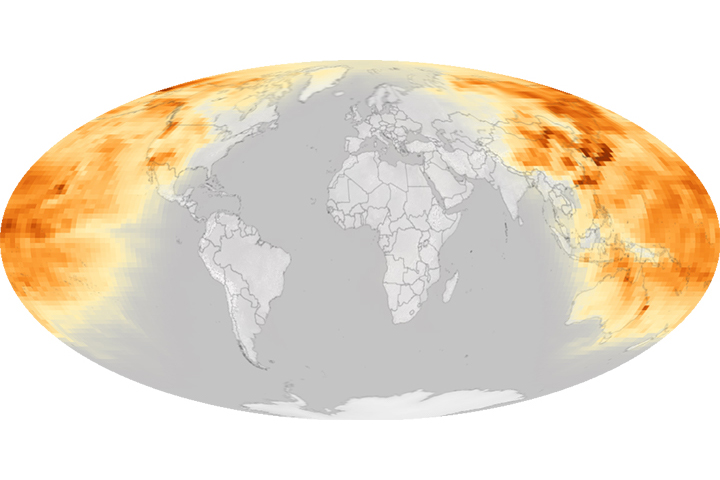
The key to pinpointing these numbers was the calculation of a new estimate of emissions from biomass burning. In the past, researchers relied on “bottom up” estimates of methane emissions based on output from the Global Fire Emissions Database (GFED), a model that estimates emissions based on satellite observations of burnt area, vegetation type, and other factors. Worden’s group supplemented the GFED estimates by incorporating satellite measurements of methane and carbon monoxide actually in the atmosphere. The “top-down” observations came from the Measurements of Pollutants in the Troposphere (MOPITT) sensor on the Terra satellite and the Tropospheric Emission Spectrometer (TES) sensor on Aura.The visualization above, based on data from GFED, shows how much land fires burned around the world between 2000 and 2015. The area burned each year decreased by about 12 percent between the early 2000s and the more recent period of 2007 to 2014, according to observations by Moderate Resolution Imaging Spectrometers, sensors on NASA’s Aqua and Terra satellites.
The logical assumption would be that methane emissions from fires would decrease by roughly the same percentage as the change in burned area. But the observations from TES and MOPITT made clear that the decrease in methane emissions was almost twice as much as that assumption would suggest.
Most methane molecules in the atmosphere do not have identifying features that reveal their origin, so tracking down their sources requires additional lines of evidence: measurements of other gases, chemical analyses, isotopic signatures, observations of land use, and more. Carbon isotopes in methane molecules proved to be particularly useful. Of the methane sources examined in the new study, emissions from fires contained the largest percentage of heavy carbon isotopes; microbial emissions have the smallest; and fossil fuel emissions were in between.
“A fun thing about this study was combining all this different evidence to piece this puzzle together,” Worden said.
NASA Earth Observatory images by Joshua Stevens, using data from the Global Fire Emissions Database and the NOAA Earth System Research Laboratory. Story by Adam Voiland (NASA Earth Observatory), based on information from a press release by Carol Rasmussen (NASA's Earth Science News Team).


