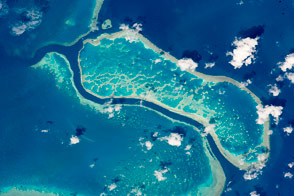
The Great Barrier Reef is the world’s largest reef structure, supporting a huge array of marine life off the coast of Queensland, Australia. The reef’s designation as a marine park helps protect it from some human pressures, such as local water pollution and overfishing. But park protection cannot prevent the heating of ocean water—the main stressor on this coral system and the reason for its bleaching.
The bright colors (and food source) of healthy coral come from the microscopic algae that live inside coral tissues. But the symbiotic relationship is compromised when the water gets too hot. Warm temperatures drive out the algae, and corals turn a pale white—the so-called bleaching that leaves corals vulnerable to disease and death. Fortunately, scientists have ways to monitor the reef. And they can do so remotely.
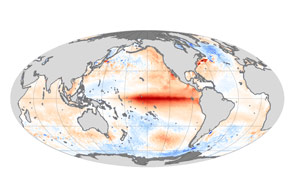
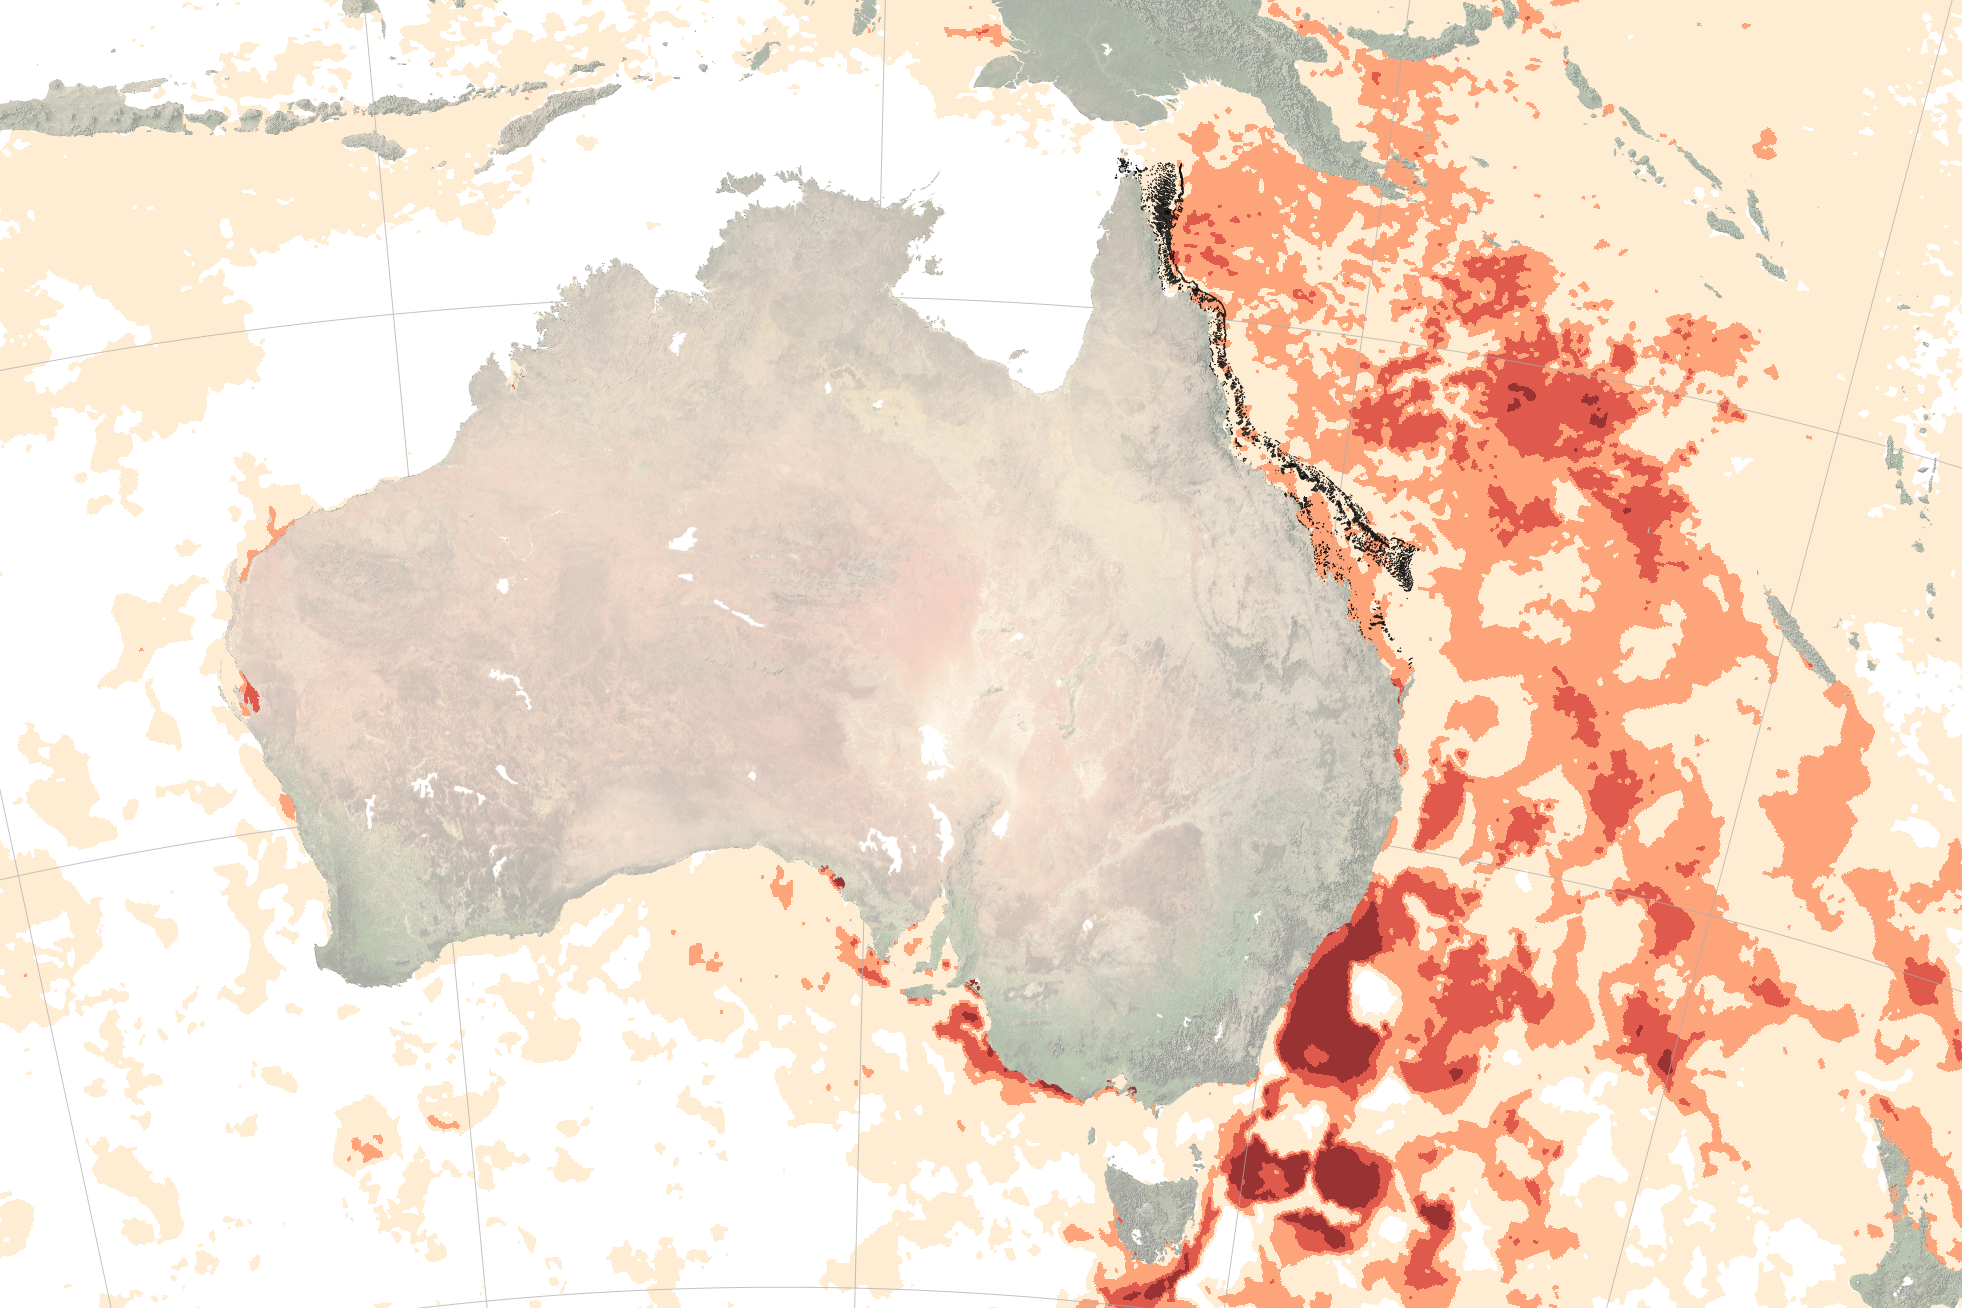
The map above, based on data from NOAA’s Coral Reef Watch, shows areas with varying levels of heat stress. The amount of heat stress is an indicator of bleaching and its potential intensity. This map shows the maximum stress reached during the seven-day period from February 21-27, 2017. Tan indicates a bleaching watch, meaning that the area may have been exposed to heat stress. Orange indicates a bleaching warning, meaning that bleaching is possible. Red indicates a bleaching alert level 1 (bleaching is likely), and dark red indicates alert level 2 (mortality is likely).
Coral Reef Watch produces maps like this for ocean areas around the world. The level of stress is based on measurements of sea surface temperature, which is derived from multiple satellites including Suomi NPP. But to figure out when conditions are deviating from normal, scientists first had to define normal. Defining this “climatology” is where the Pleiades supercomputer at NASA’s Ames Research Center contributed.
As the map shows, many areas in late February were far from normal; some level of heat stress was present almost everywhere in the waters east of Australia. According to Mark Eakin, coordinator of Coral Reef Watch, the current bleaching on the Great Barrier Reef is part of a global bleaching event that started in June 2014 and has been ongoing. It is the third global coral bleaching event since the 1980s.
“Unlike past global bleaching events (in 1998 and 2010) that lasted less than twelve months, this event is in its 33rd month and shows no sign of stopping,” Eakin said. “It has been the longest, most widespread, and most damaging coral bleaching event ever recorded.”
The reef appears small on this map, and even smaller on global maps. But providing data only over reefs would exclude the bigger picture. “The conditions in surrounding ocean waters is very informative when trying to understand what is and may soon be happening on reefs,” Eakin said.
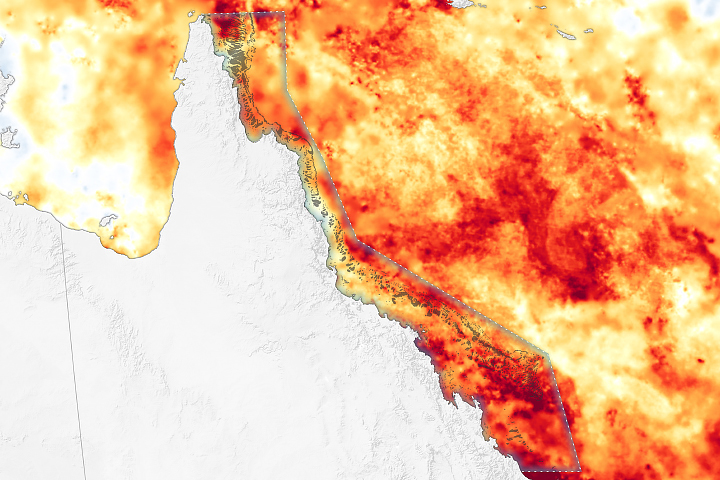
Scientists are making progress in gaining that understanding thanks to a combination of this satellite-derived information and some recent aerial and underwater surveys of the Great Barrier Reef. In new findings published in Nature on March 15, 2017, researchers showed that severe heat stress and bleaching spanned the northern 1,000 kilometers of the Great Barrier Reef during the severe bleaching of 2016. In contrast, earlier events in 1998 and 2002 severely bleached the reef farther south. At one time or another, bleaching has affected almost the entire span of the reef.
The ARC Centre of Excellence for Coral Reef Studies noted in a statement about the new study: “Coral bleaching events should no longer be thought of as individual disturbances to reefs, but as recurring events that threaten the viability of coral reefs globally.”
NASA Earth Observatory map by Joshua Stevens, using data from Coral Reef Watch. Caption by Kathryn Hansen.