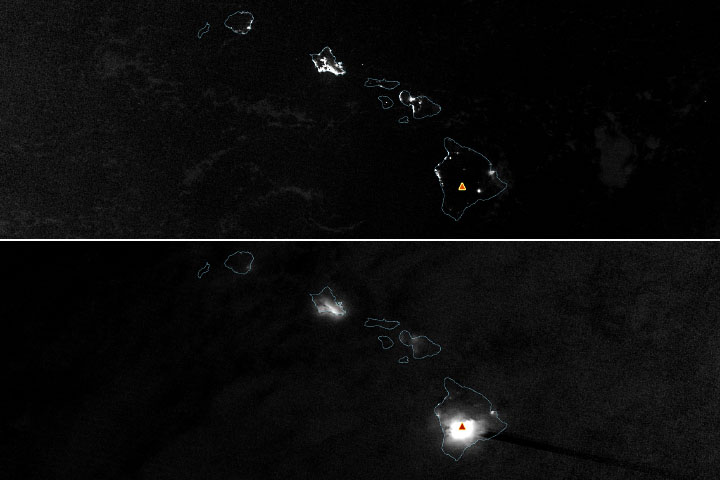
The world’s largest active volcano—Hawaii’s Mauna Loa—has been quiet for the past 38 years. But in 2022, the volcano began to stir, showing increased numbers of small earthquakes and subtle swelling of certain land surfaces in September. On November 27, fountains of lava began spurting from the mountain’s Northeast Rift Zone and streams of molten rock flowed to the north.
Ten days into the eruption, a NASA aircraft conducted its first flight over the erupting volcano. It carried NASA’s Uninhabited Aerial Vehicle Synthetic Aperture Radar (UAVSAR) system, which was used to map the volcano’s topography in fine detail with a Ka-band instrument called GLISTIN-A.
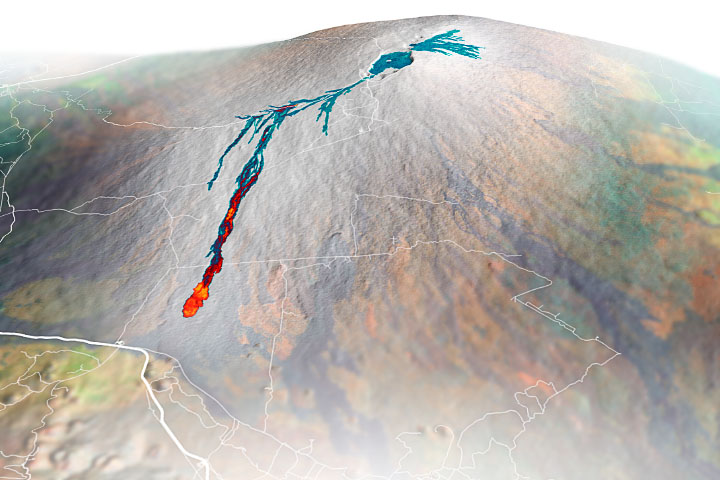
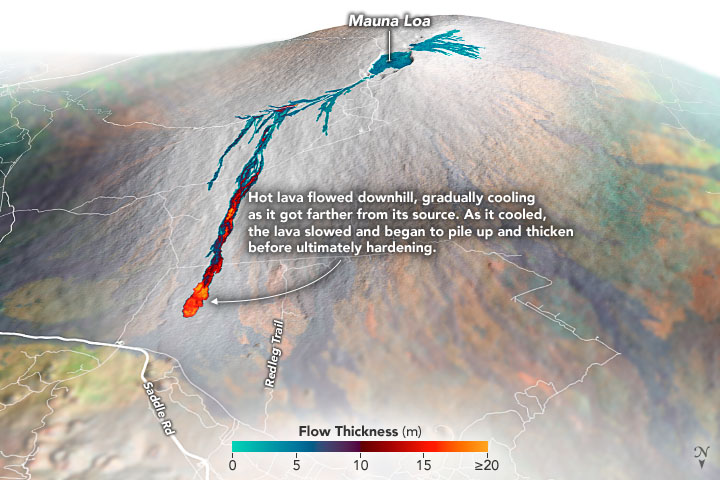
Teams from NASA’s Jet Propulsion Laboratory and the United States Geological Survey (USGS) used data from that sensor to map the thickness of those flows during a series of flights on December 7, 8, and 10. The map above shows the thickness of the lava flows during the flight on December 7, the day before USGS scientists noticed a significant decline in the pace of the eruption. A few days later, they declared the eruption had stopped. The map shows the thickness of the lava flows in the summit caldera, where the eruption began, and of lava flows on Mauna Loa’s northeastern flank. The color variation from blue to orange indicates increasing lava flow thickness. A maximum thickness of roughly 25 meters (82 feet) is shown, though values exceeding 40 meters (131 feet) were observed in some areas.
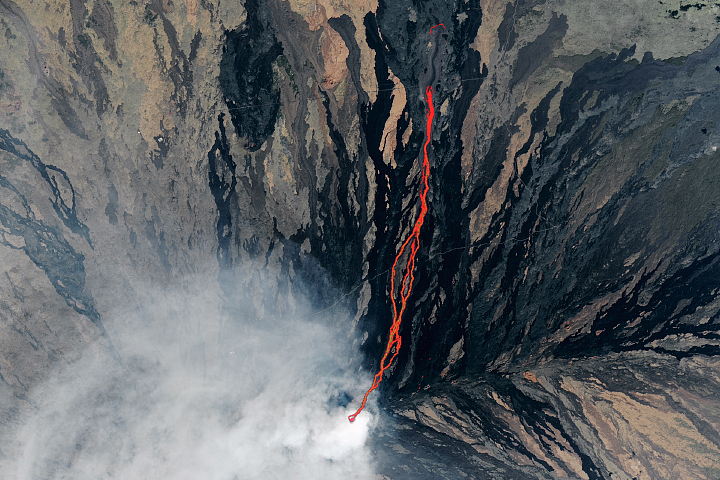
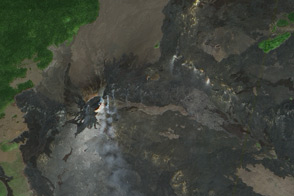
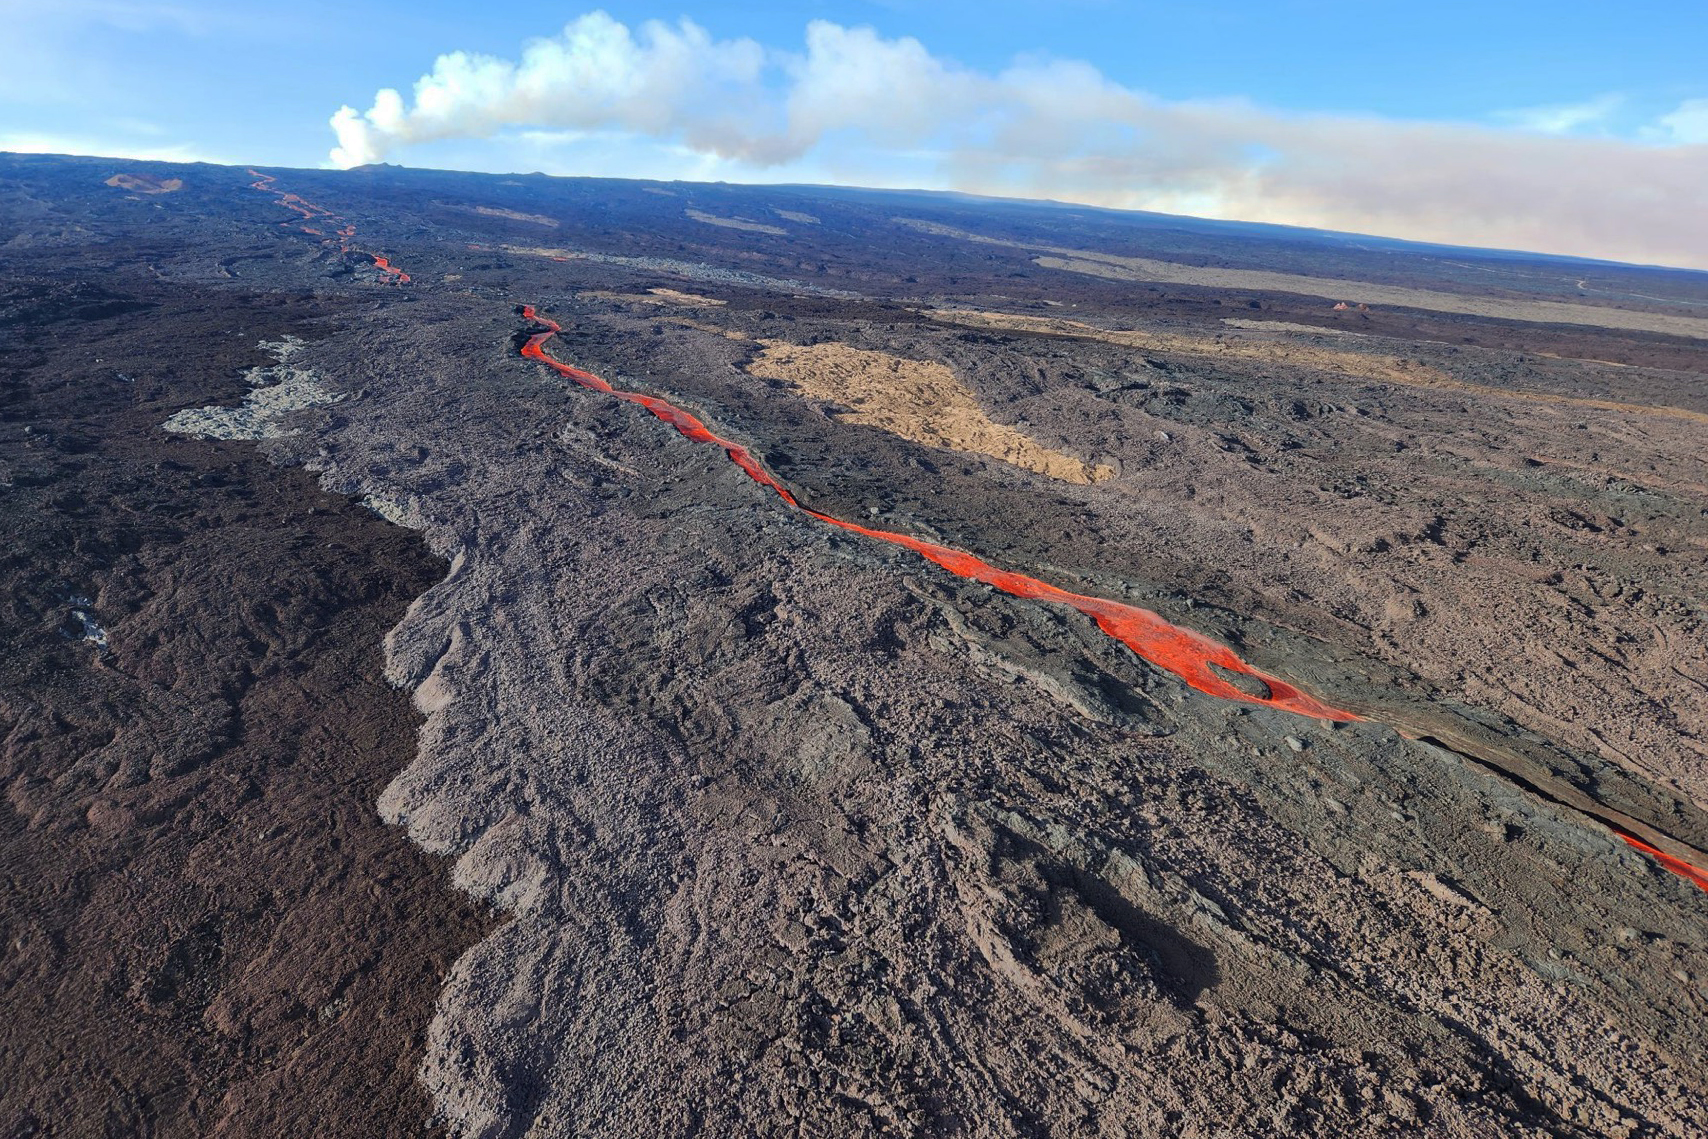
The thickening at the northern end of the flow is due to lava cooling and hardening with distance away from the vent, along with a flattening of the terrain at the saddle between the Mauna Loa and Mauna Kea volcanoes. Both of these factors contributed to the flow slowing down and piling up in that area. The GLISTIN data were laid over a 2017 natural-color Landsat 8 image of the mountain and a digital elevation model from the Shuttle Radar Topography Mission to offer a more realistic view of Mauna Loa’s appearance and topography. The USGS aerial photograph below shows part of the main lava flow on December 7, 2022.
By comparing to pre-eruption maps of this area’s topography, including GLISTIN-A data collected in 2017, the USGS researchers were able to calculate the size and volume of the lava flow. Over the roughly 14-day eruption, Mauna Loa erupted more than 8.8 billion cubic feet (230 million cubic meters) along a lava flow that extended up to 12.1 miles (19.5 kilometers) from the vent, according to the USGS.
The UAVSAR operates from a pod mounted beneath a crewed Gulfstream III jet from NASA’s Armstrong Flight Research Center in California. Repeated topographic maps generated with each flight reveal the progression and thickening of lava with time—important information for scientific understanding of volcano processes and for emergency response.
For the Mauna Loa science flights, the instrument suite featured an additional state-of-the-art imaging tool: the synthetic aperture radar-fusion optical short-wave infrared (SAR-Fusion Optical/SWIR) camera system. SAR-Fusion collects data over the same ground swath as GLISTIN-A to map land surface changes using optical/SWIR photogrammetry methods. GLISTIN-A was designed to provide all-weather, high-resolution surface topography not available through existing lidar or radar sensors.
GLISTIN-A was originally demonstrated as a new radar technique for mapping ice surfaces. Science demonstration flights began in 2013 over alpine glaciers and sea ice in Alaska, and a floodplain in California. Its applications have since expanded to other areas, such as snow accumulation and volcano dynamics. The first time the instrument was deployed for volcano response was in 2018 during the three-month eruption of Kīlauea. The success of that operation paved the way for deployment to Mauna Loa.
NASA Earth Observatory image by Joshua Stevens, using GLISTEN-A UAVSAR data courtesy of Paul Lundgren/NASA JPL-Caltech, Landsat data from the U.S. Geological Survey, and topographic data from the Shuttle Radar Topography Mission (SRTM). USGS photo by K. Lynn. Story by Sally Younger with Adam Voiland. Fact checking by Hannah Dietterich (USGS).