The Earth Observatory has published its last Image of the Day on this website. Please join us on our new home at science.nasa.gov/earth/earth-observatory.
Trees provide numerous environmental services: They draw carbon dioxide from the atmosphere and emit oxygen into it; they cool the air and the ground by providing shade; they absorb storm water and hold soil in place. Their mere presence raises property values. Research has also found that greener areas benefit human health and well-being.
But trees, and the benefits they provide, are not evenly distributed, especially in urban areas. And it is here, where buildings and streets create heat islands, that trees could help improve public health and reduce mortality, according to new research published in Frontiers in Public Health.
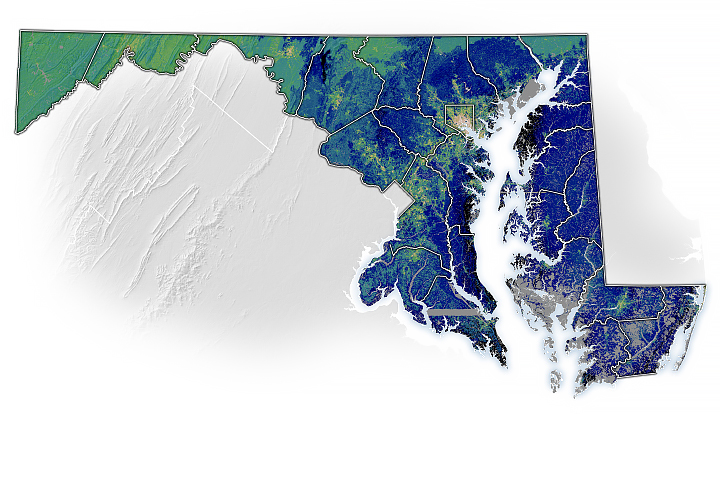
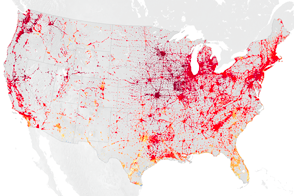
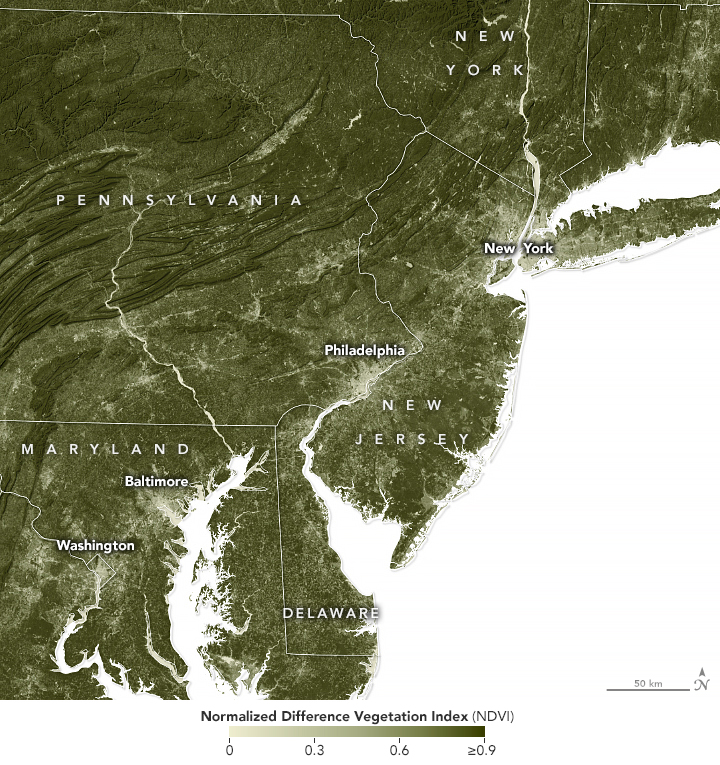
The researchers, led by Paige Brochu, a doctoral student in environmental health at Boston University, assessed the impact of greenness on human mortality across two decades in 35 of the most populated metropolitan areas in the United States. The team used a Normalized Difference Vegetation Index (NDVI) built from Landsat imagery to see how the quantity of green vegetation had changed around cities from 2000 to 2010 to 2019. NDVI is a calculation of the ratio of near-infrared to visible light, and it is used to measure the abundance and health of vegetation.
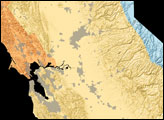
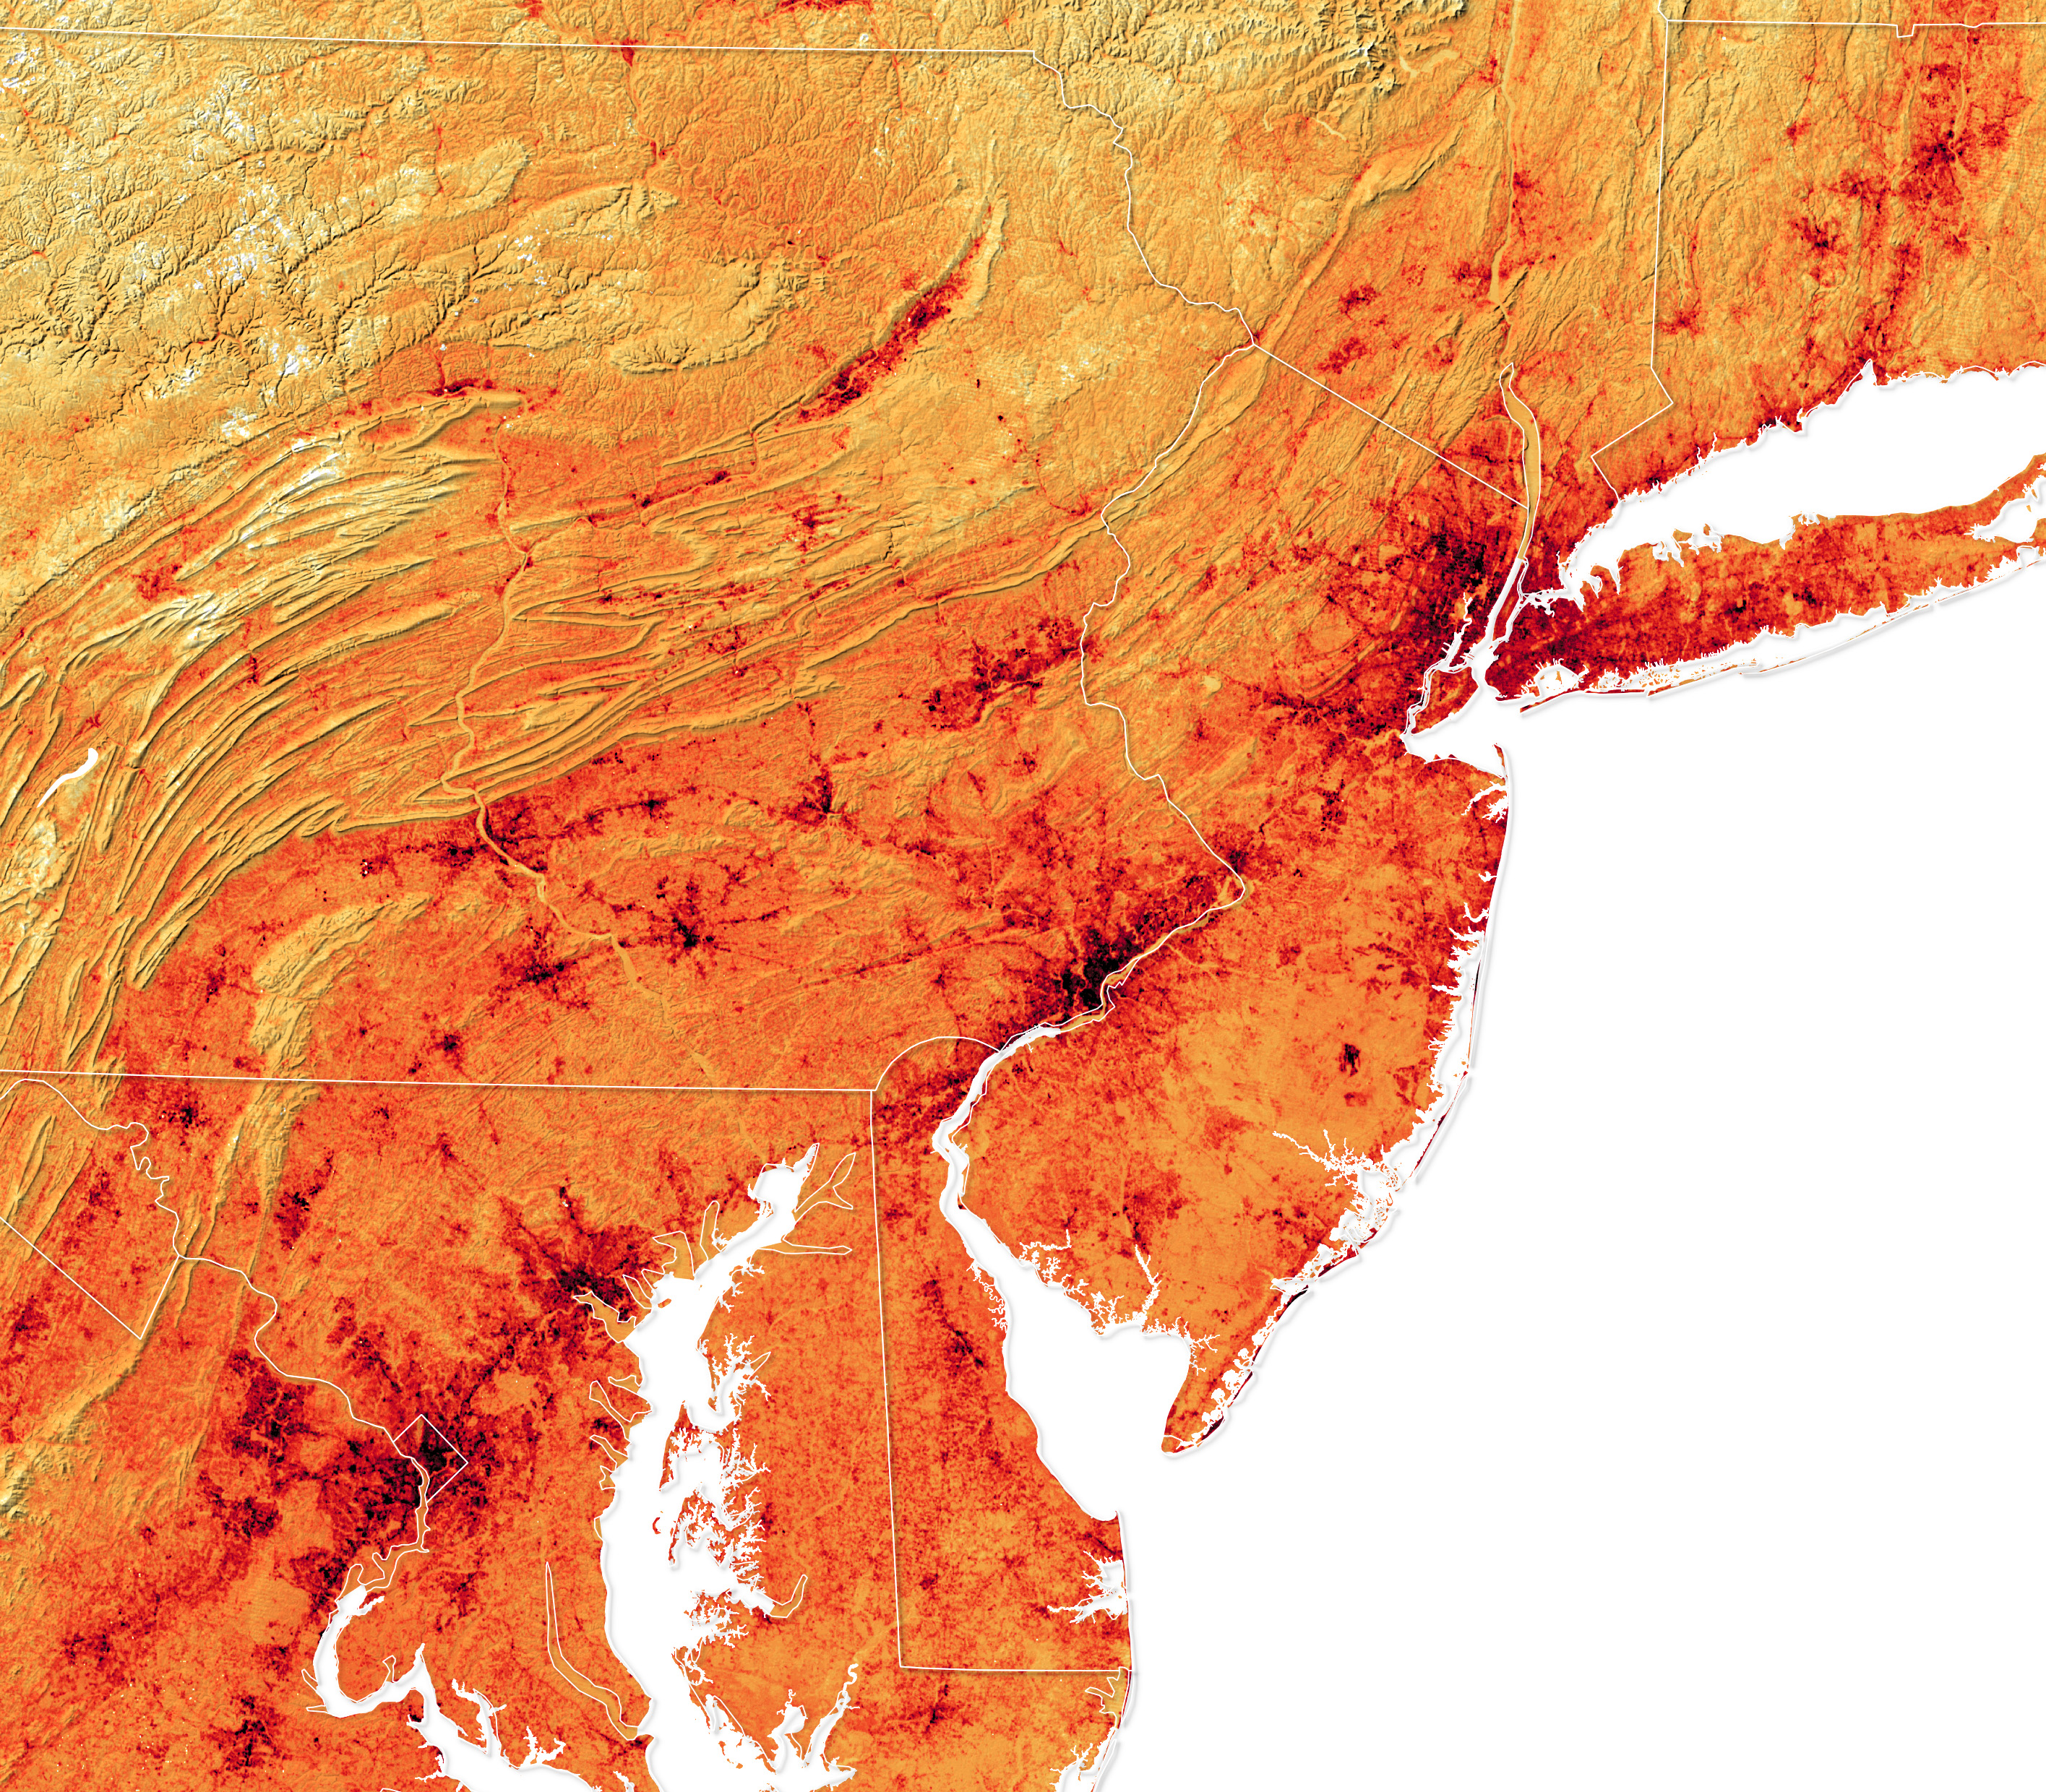
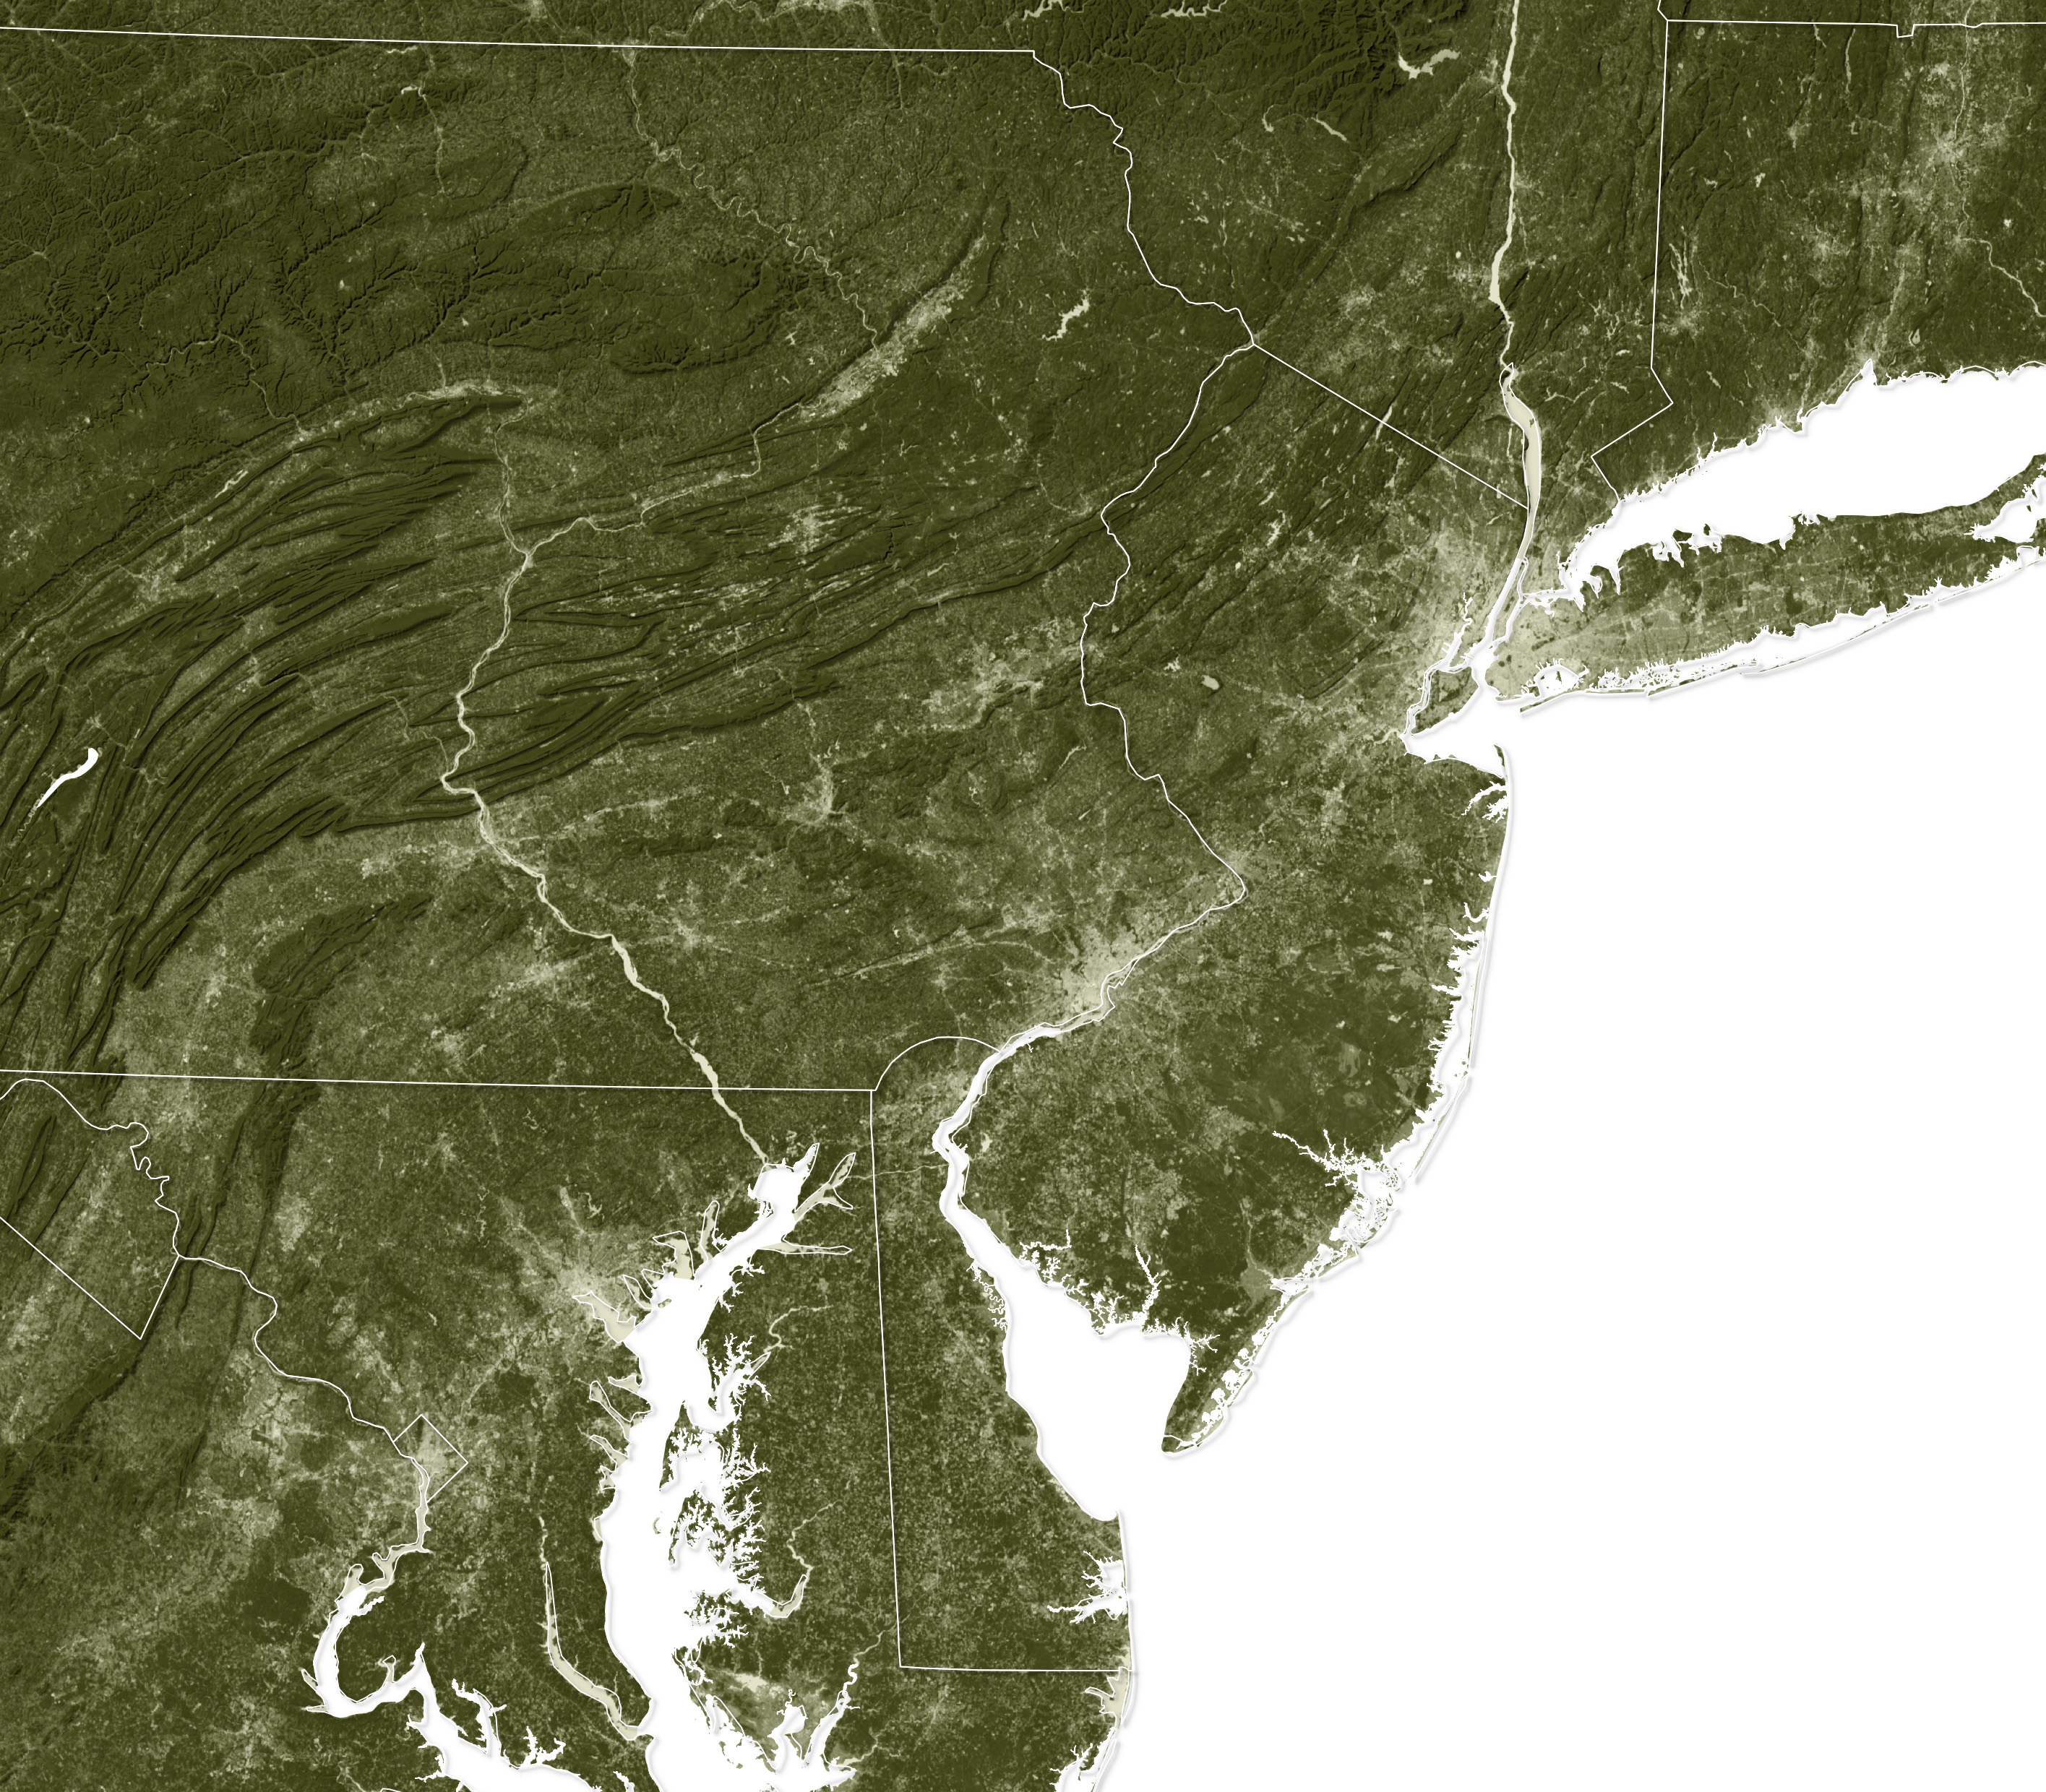
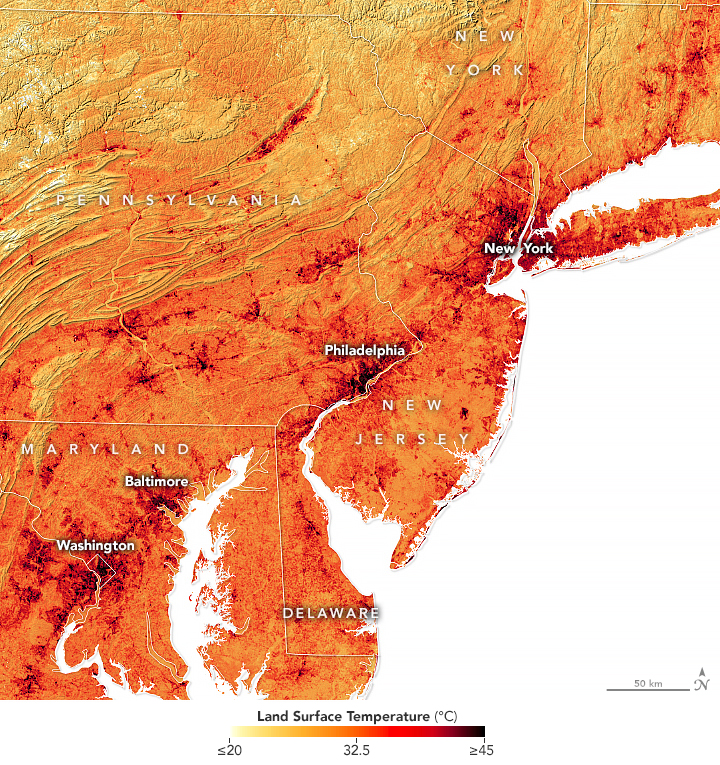
The maps above show the abundance of vegetation around several urban areas in the Northeast, as well as the average land surface temperatures. The maps were made using data acquired by the Operational Land Imager (OLI) on Landsat 8 from June 21 to September 22, 2019. (Calculations of NDVI for a given pixel result in a number that ranges from minus one (-1) to plus one (+1).)
Brochu’s team found that overall greenness increased in the urban areas studied by an average of 2.86 percent between 2000 and 2010. It increased by an additional 11.11 percent from 2010 to 2019. The researchers then compared the changes in greenness to county-level mortality data for people aged 65 and older, as reported by the Centers for Disease Control and Prevention.
“The connection between exposure to greenness or green vegetation and mortality is not necessarily as direct as the connection between air pollution and respiratory diseases. There are multiple direct and indirect ways in which exposure to greenness—such as living near a green park or having trees along sidewalks on our daily walks—can impact our health and, in the long-term, impact all-cause mortality,” Brochu said. “This can include reducing our exposure to heat islands in urban areas by having trees providing shade that can prevent heat-related deaths. There is also evidence that living near green spaces or parks can increase physical activity and recreation, in turn leading to lower risks of chronic diseases such as obesity.”
The scientists assessed how an increase in greenness might affect mortality using previously identified exposure-response functions, which quantify the relationship between greenness and health, Brochu said. Such metrics account for some societal factors, such as race and income, that can affect access and exposure to greenness.
The team’s analysis found that even small improvements in greenness could have further reduced mortality. “We estimated that between 34,000 and 38,000 all-cause deaths could have been reduced in 2000, 2010, and 2019 with a local increase in green vegetation by 0.1 unit [of NDVI] across the most populated metropolitan areas,” the team wrote.
“This study really helps quantify and give a tangible number to policymakers about the public health impact of greening initiatives and climate action plans,” Brochu said.
Another study, led by Robert McDonald of the Nature Conservancy, investigated the disparities in tree cover and temperature in urban areas of the U.S. and found they correlated strongly with income.
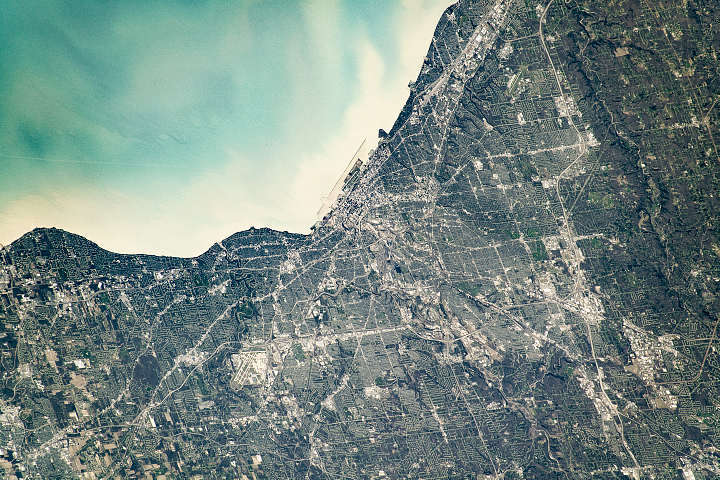
Using high-resolution (2-meter) tree cover maps derived from aerial photographs and Landsat data on summer land-surface temperatures, McDonald’s team examined how tree cover and urban heat related to income, race, and ethnicity. Working all the way down to the block level, the researchers examined 5,723 communities that are collectively home to 167 million people.
In 92 percent of the areas studied, low-income blocks were found to have an average of 15.2 percent less tree cover; they also endured summer temperatures that were 1.5°C (2.7°F) hotter than high-income blocks. Areas with less tree cover have less shade, and also lack the other cooling effects that vegetation provides.
“The greatest difference between low- and high-income blocks was found in the Northeast, where low-income blocks in some urbanized areas have 30 percent less tree cover and are 4°C hotter,” the team wrote in PLOS ONE.
Even after controlling for other factors that could confound the associations, such as building and population densities, “the positive association between income and tree cover is significant, as is the positive association between [the] proportion [of] non-Hispanic white [residents] and tree cover,” they wrote.
“It is true that high-density neighborhoods have more impervious surface cover, and we believe this is what leads on average to lower tree cover in these neighborhoods,” McDonald said. Impervious surface cover, such as asphalt and concrete, also absorbs, holds, and re-radiates heat, creating the urban heat island effect. “There just isn’t space for as much tree cover as [there is] in the suburbs.”
The researchers found that low-income blocks collectively have 62 million fewer trees than high-income blocks. “An investment in tree planting and natural regeneration of $17.6 billion would be needed to close the tree-cover disparity,” McDonald and colleagues wrote,“benefitting 42 million people in low-income blocks.”
NASA Earth Observatory images by Lauren Dauphin, using Landsat data from the U.S. Geological Survey and topographic data from the Shuttle Radar Topography Mission (SRTM). Story by Sara E. Pratt.