In the upper reaches of the atmosphere, at the boundary between Earth and space, particles and gases and energy do an intricate and colorful dance that varies daily. A new satellite is watching that dance close up.
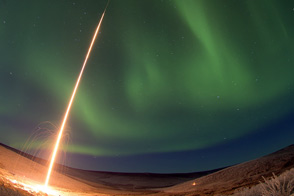
Between 80 and 600 kilometers (50 and 400 miles) above the ground, radiation from the Sun cooks the gases in our upper atmosphere until they lose electrons. The result is a sea of electrically charged particles—ions—intermingled with the neutral upper atmosphere. The visible expressions of this energy flow are auroras and airglow.
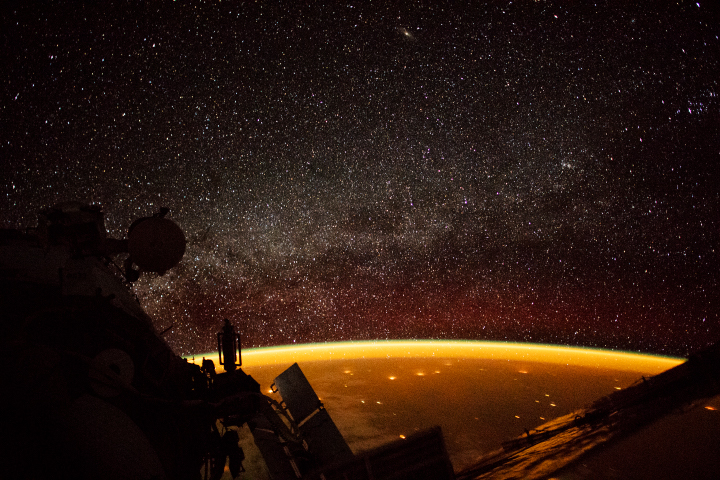
Airglow typically appears in thin layers of red, green, purple, or yellow light when looking toward the limb of Earth and edge-on into our upper atmosphere. Airglow occurs when atoms and molecules, excited by sunlight, emit light to shed their excess energy. It also can form when atoms and molecules that have been ionized by sunlight collide with and capture a free electron. In both cases, they eject a particle of light (a photon) in order to relax again. Each atmospheric gas has a dominant airglow color that depends on the gas, the altitude, and the excitation process.
Unlike auroras, which are episodic and fleeting, airglow shines almost constantly. Just a tenth as bright as all the stars in the night sky, airglow is hard to observe except from orbit or from the ground with clear, dark skies and a sensitive camera. Airglow carries information about the temperature, density, and composition of the upper atmosphere, and also helps us trace how particles move through the region.
The Ionospheric Connection Explorer (ICON) was launched in October 2019 to study the uppermost reaches of the atmosphere, particularly airglow. After several weeks of spacecraft maneuvers, tests, and calibration, ICON began taking science data on December 1. Thomas Immel, principal investigator and a scientist at the University of California, Berkeley, presented the first images—above and below on this page—in mid-December 2019.
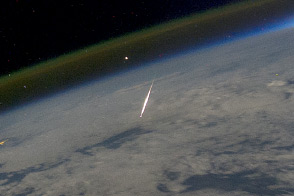
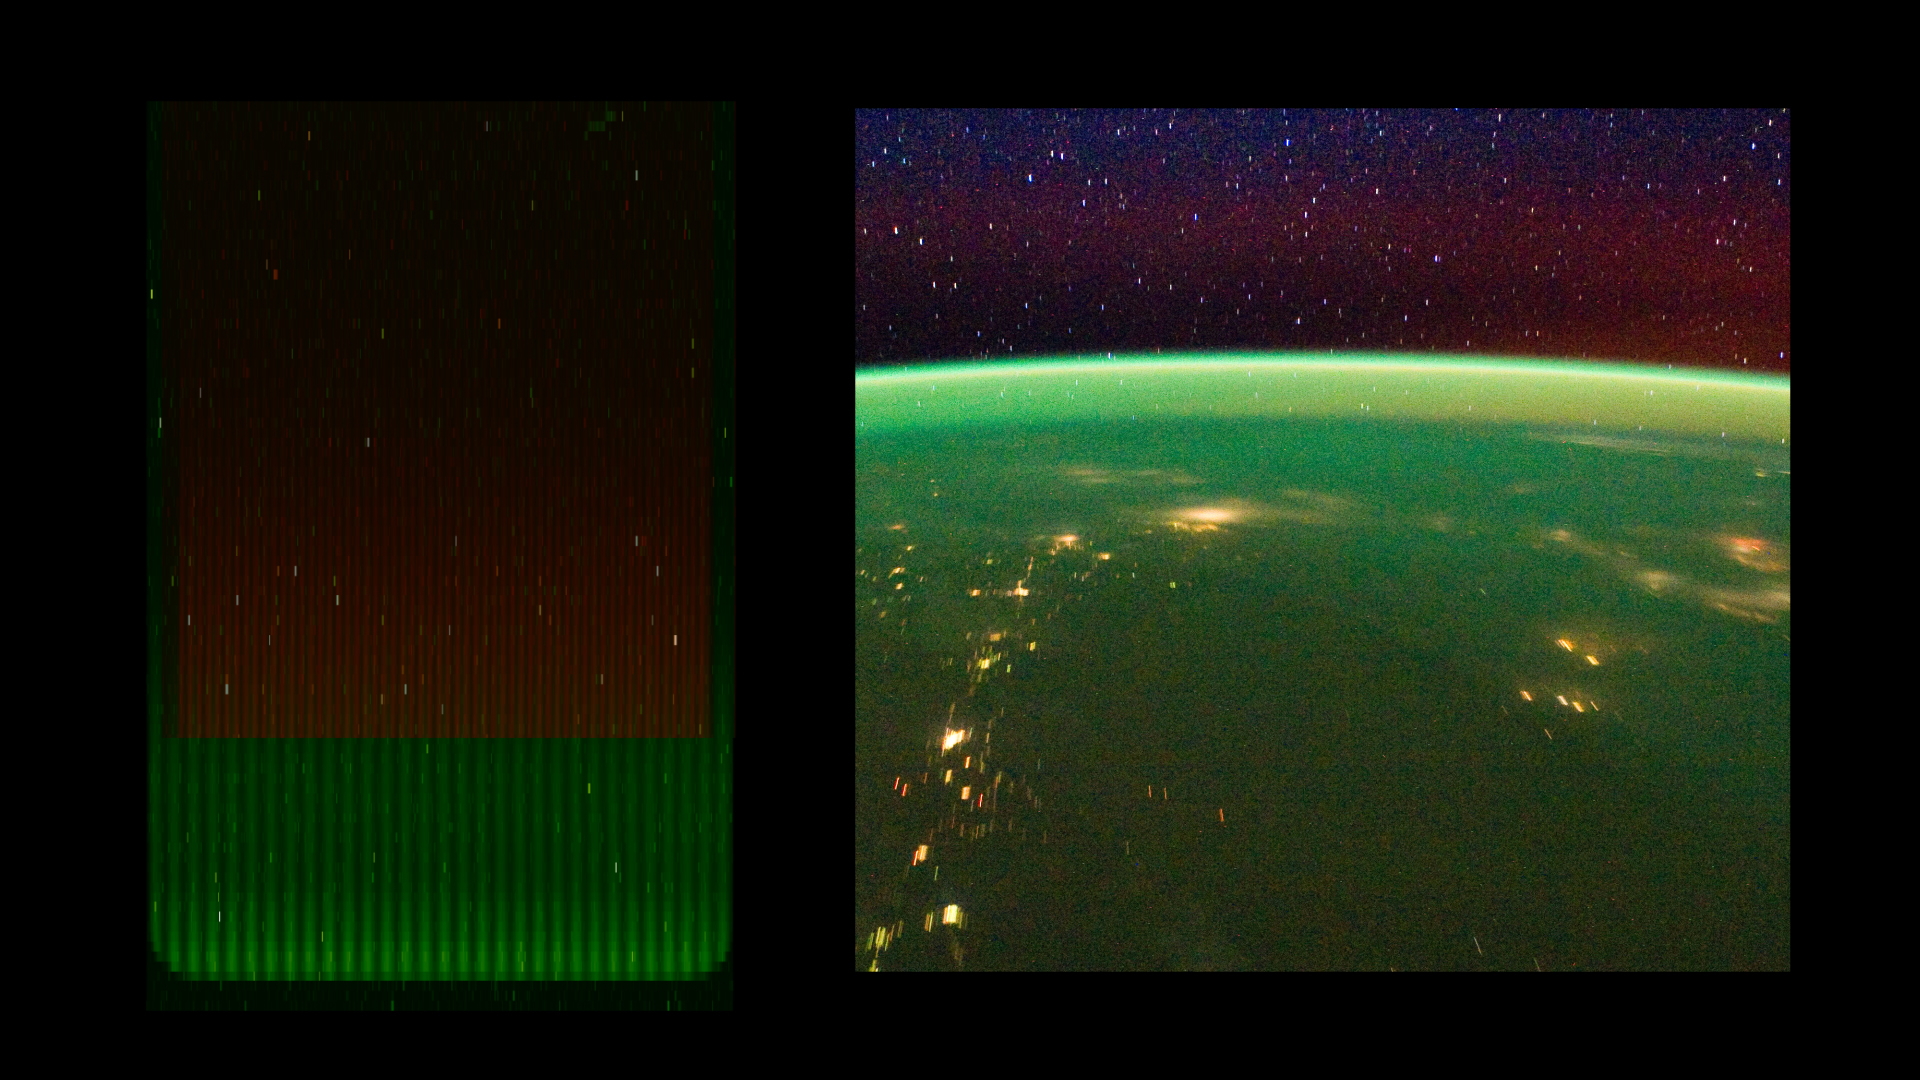
The still image and video at the top of the page show airglow on and above the horizon (along with other atmospheric dynamics like thunderstorms). The still image pairs ICON observations of airglow (left) with what an astronaut sees (right) from the the International Space Station. The video is a time-lapse of astronaut photographs.
The animated images above show Earth’s limb as observed by ICON in far ultraviolet light, a means for measuring the density and composition of the ionosphere. The pink light (purple background) reveals nitrogen emissions, while the green light (blue background) is oxygen emissions. The lights above the horizon are stars and planets moving across the horizon.
The video below includes observations from the Michelson Interferometer for Global High-resolution Thermospheric Imaging (MIGHTI), which tracks red and green oxygen airglow to measure how the neutral atmosphere moves. There is a black fringe pattern laid over images. By measuring how airglow moves against those black lines, scientists can read the motions, or the winds, of the upper atmosphere.
Observations from ICON are designed to complement global views of the ionosphere as observed by the Global-scale Observations of the Limb and Disk (GOLD) instrument on a geostationary satellite. The relationship between the two ionospheric missions could be likened to photography. If GOLD captures landscapes from 22,000 miles above Earth, ICON (at just 360 miles) specializes in detailed close-ups. During certain parts of its orbit, ICON passes through GOLD’s field of view, giving each mission a snapshot of the same region and events from different perspectives.
NASA images courtesy of ICON/Harald Frey/Thomas Bridgman and ICON/Christoph Englert/Joy Ng. Airglow video from the ISS Crew Earth Observations Facility and the Earth Science and Remote Sensing Unit, Johnson Space Center. Story by Lina Tran, NASA Goddard Space Flight Center, with Mike Carlowicz.