With the fire season in the Amazon approaching its midpoint, scientists using NASA satellites to track fire activity have confirmed an increase in the number and intensity of fires in the Brazilian Amazon in 2019, making it the most active fire year in that region since 2010.
Fire activity in the Amazon varies considerably from year-to-year and month-to-month, driven by changes in economic conditions and climate. August 2019 stands out because it has brought a noticeable increase in large, intense, and persistent fires burning along major roads in the central Brazilian Amazon, explained Douglas Morton, chief of the Biospheric Sciences Laboratory at NASA’s Goddard Space Flight Center. While drought has played a large role in exacerbating fires in the past, the timing and location of fire detections early in the 2019 dry season are more consistent with land clearing than with regional drought.
“Satellites are often the first to detect fires burning in remote regions of the Amazon,” Morton said. NASA’s primary tool for fire detections since 2002 has been the Moderate Resolution Imaging Spectroradiometer (MODIS) instruments on the Terra and Aqua satellites.
At this point in the fire season, MODIS active fire detections in 2019 are higher across the Brazilian Amazon than in any year since 2010. The state of Amazonas is on track for record fire activity in 2019.
Morton noted that 2019 fire activity statistics distributed by NASA and Brazil’s Instituto Nacional de Pesquisas Espaciais (INPE) are in agreement. “INPE also uses active fire data from NASA’s MODIS sensors to monitor fire activity in the Brazilian Amazon,” Morton said. “As a result, NASA and INPE have the same estimates of changes in recent fire activity. MODIS detections are higher in 2019 than at this time last year in all seven states that comprise the Brazilian Amazon.”
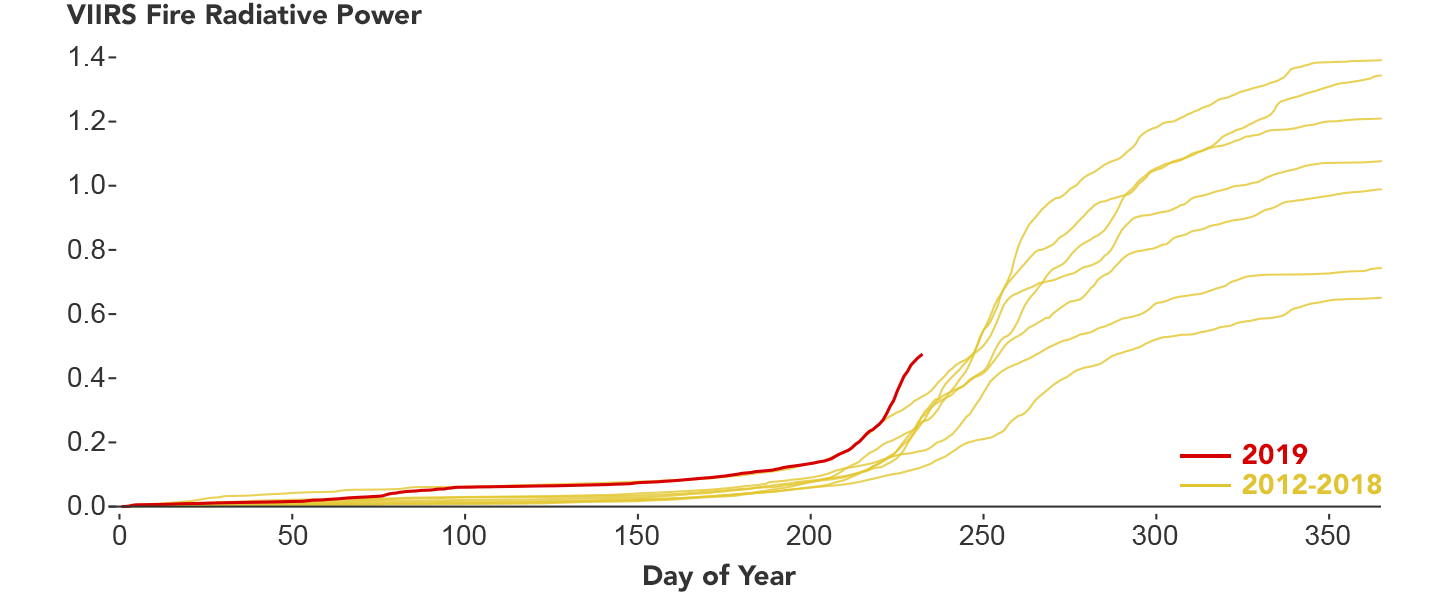
MODIS fire detections are analyzed by the Global Fire Emissions Database (GFED) project, which includes Morton and colleagues from NASA Goddard, the University of California, Irvine, and Vrije Universiteit Amsterdam. Over the years, the GFED team has processed 17 years of NASA satellite data to better understand the role of fire for changes in the Earth system. Their analysis of the southern Amazon includes parts of Brazil, Peru, and Bolivia that typically see fires between July and October. Their data plots are available online here.
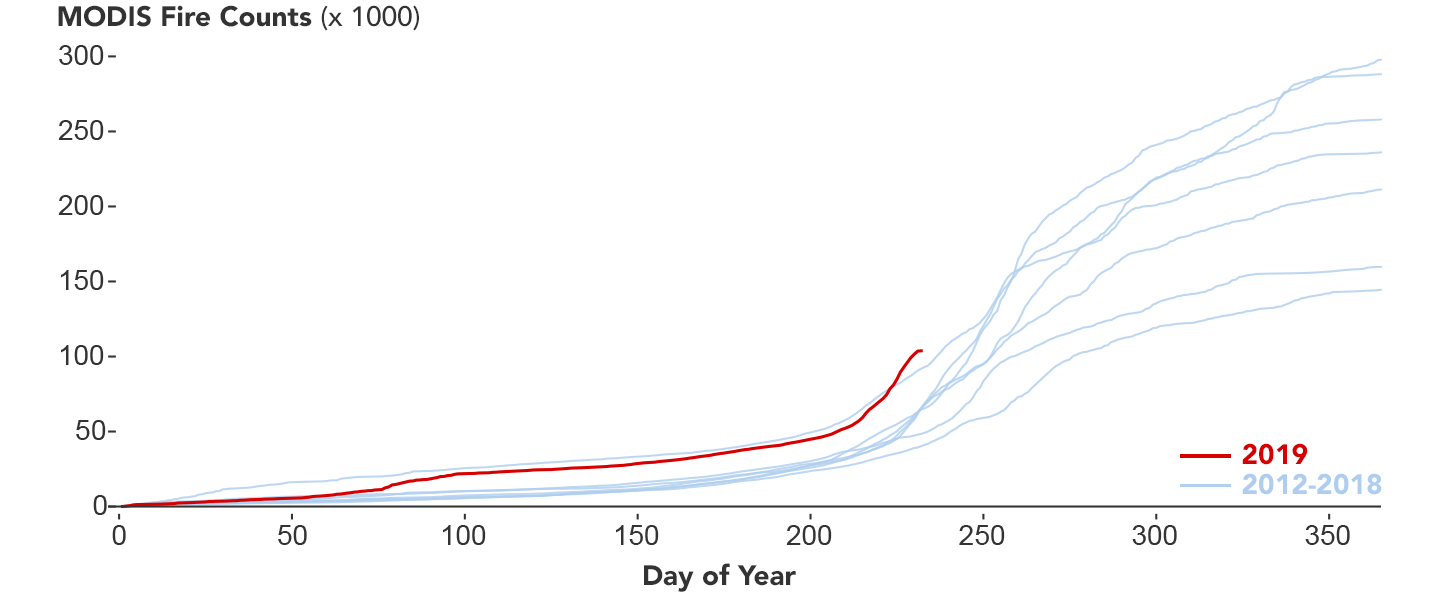
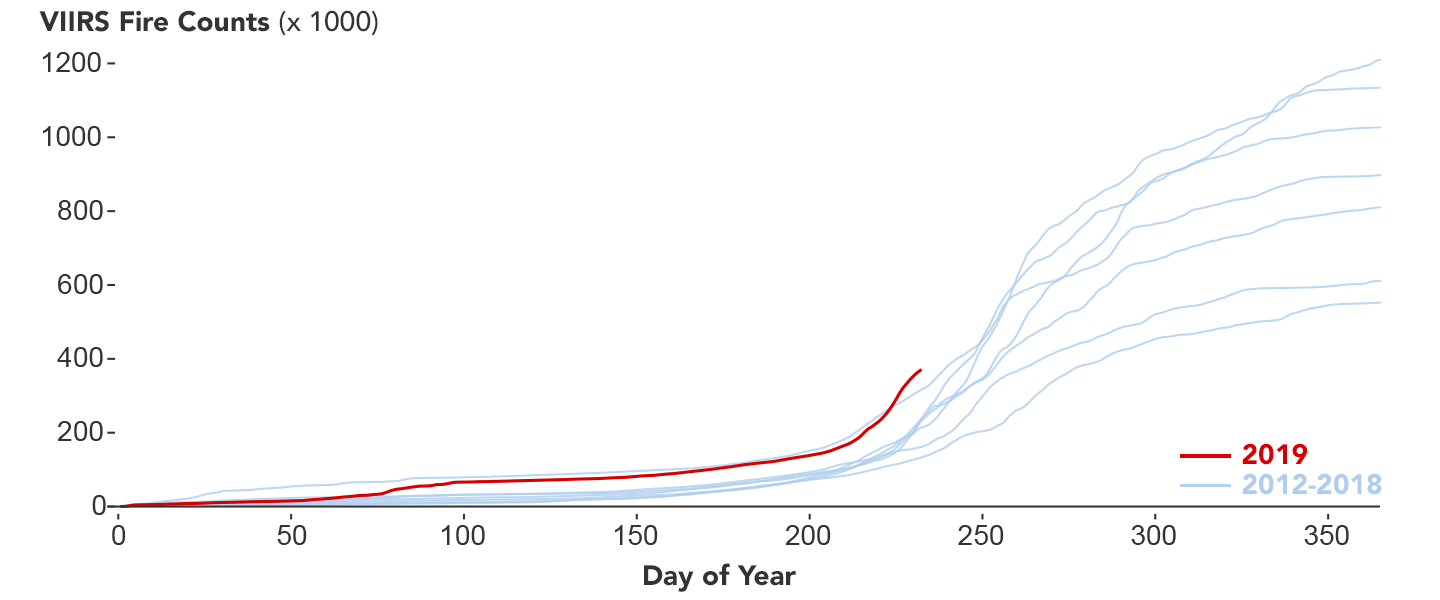
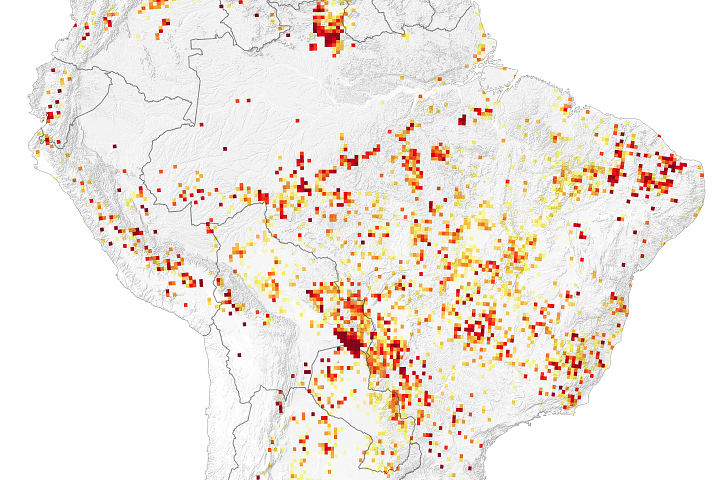
These plots show cumulative active fire detections from MODIS and the Visible Infrared Imaging Radiometer Suite (VIIRS) on Suomi NPP through August 22, 2019. The data confirm that 2019 is the highest fire year since 2012 (the start of the VIIRS record) across the seven states that comprise the Brazilian Amazon. In addition, fires in 2019 are more intense than previous years, as measured in terms of cumulative fire radiative power.

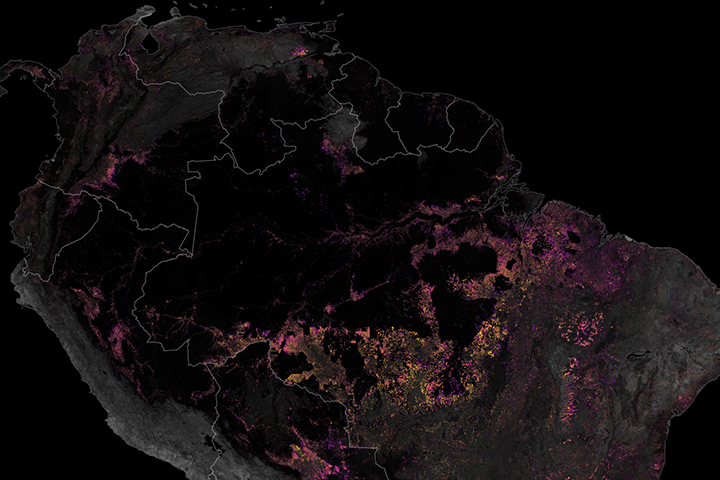
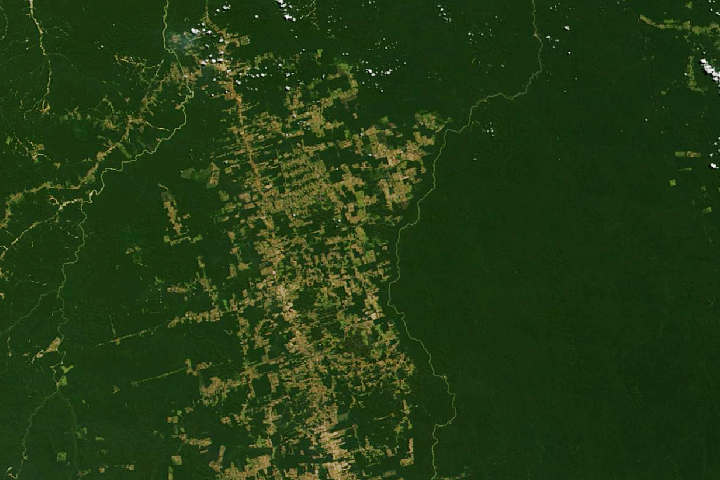
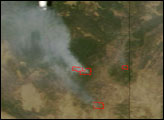
On August 19, 2019, the MODIS instrument on NASA’s Terra satellite captured a natural-color image (top of the page) that shows fires burning in the vicinity of Novo Progresso in the Brazilian state of Pará. The town is located along BR-163, a straight north-south highway that connects farmers in the southern Amazon with an ocean-going port on the Amazon river in Santarém. Pasture and croplands are clustered around the highway in ordered, rectangular plots. To the west of the highway, winding roads connect a series of small-scale mines that extend deep into the rainforest.
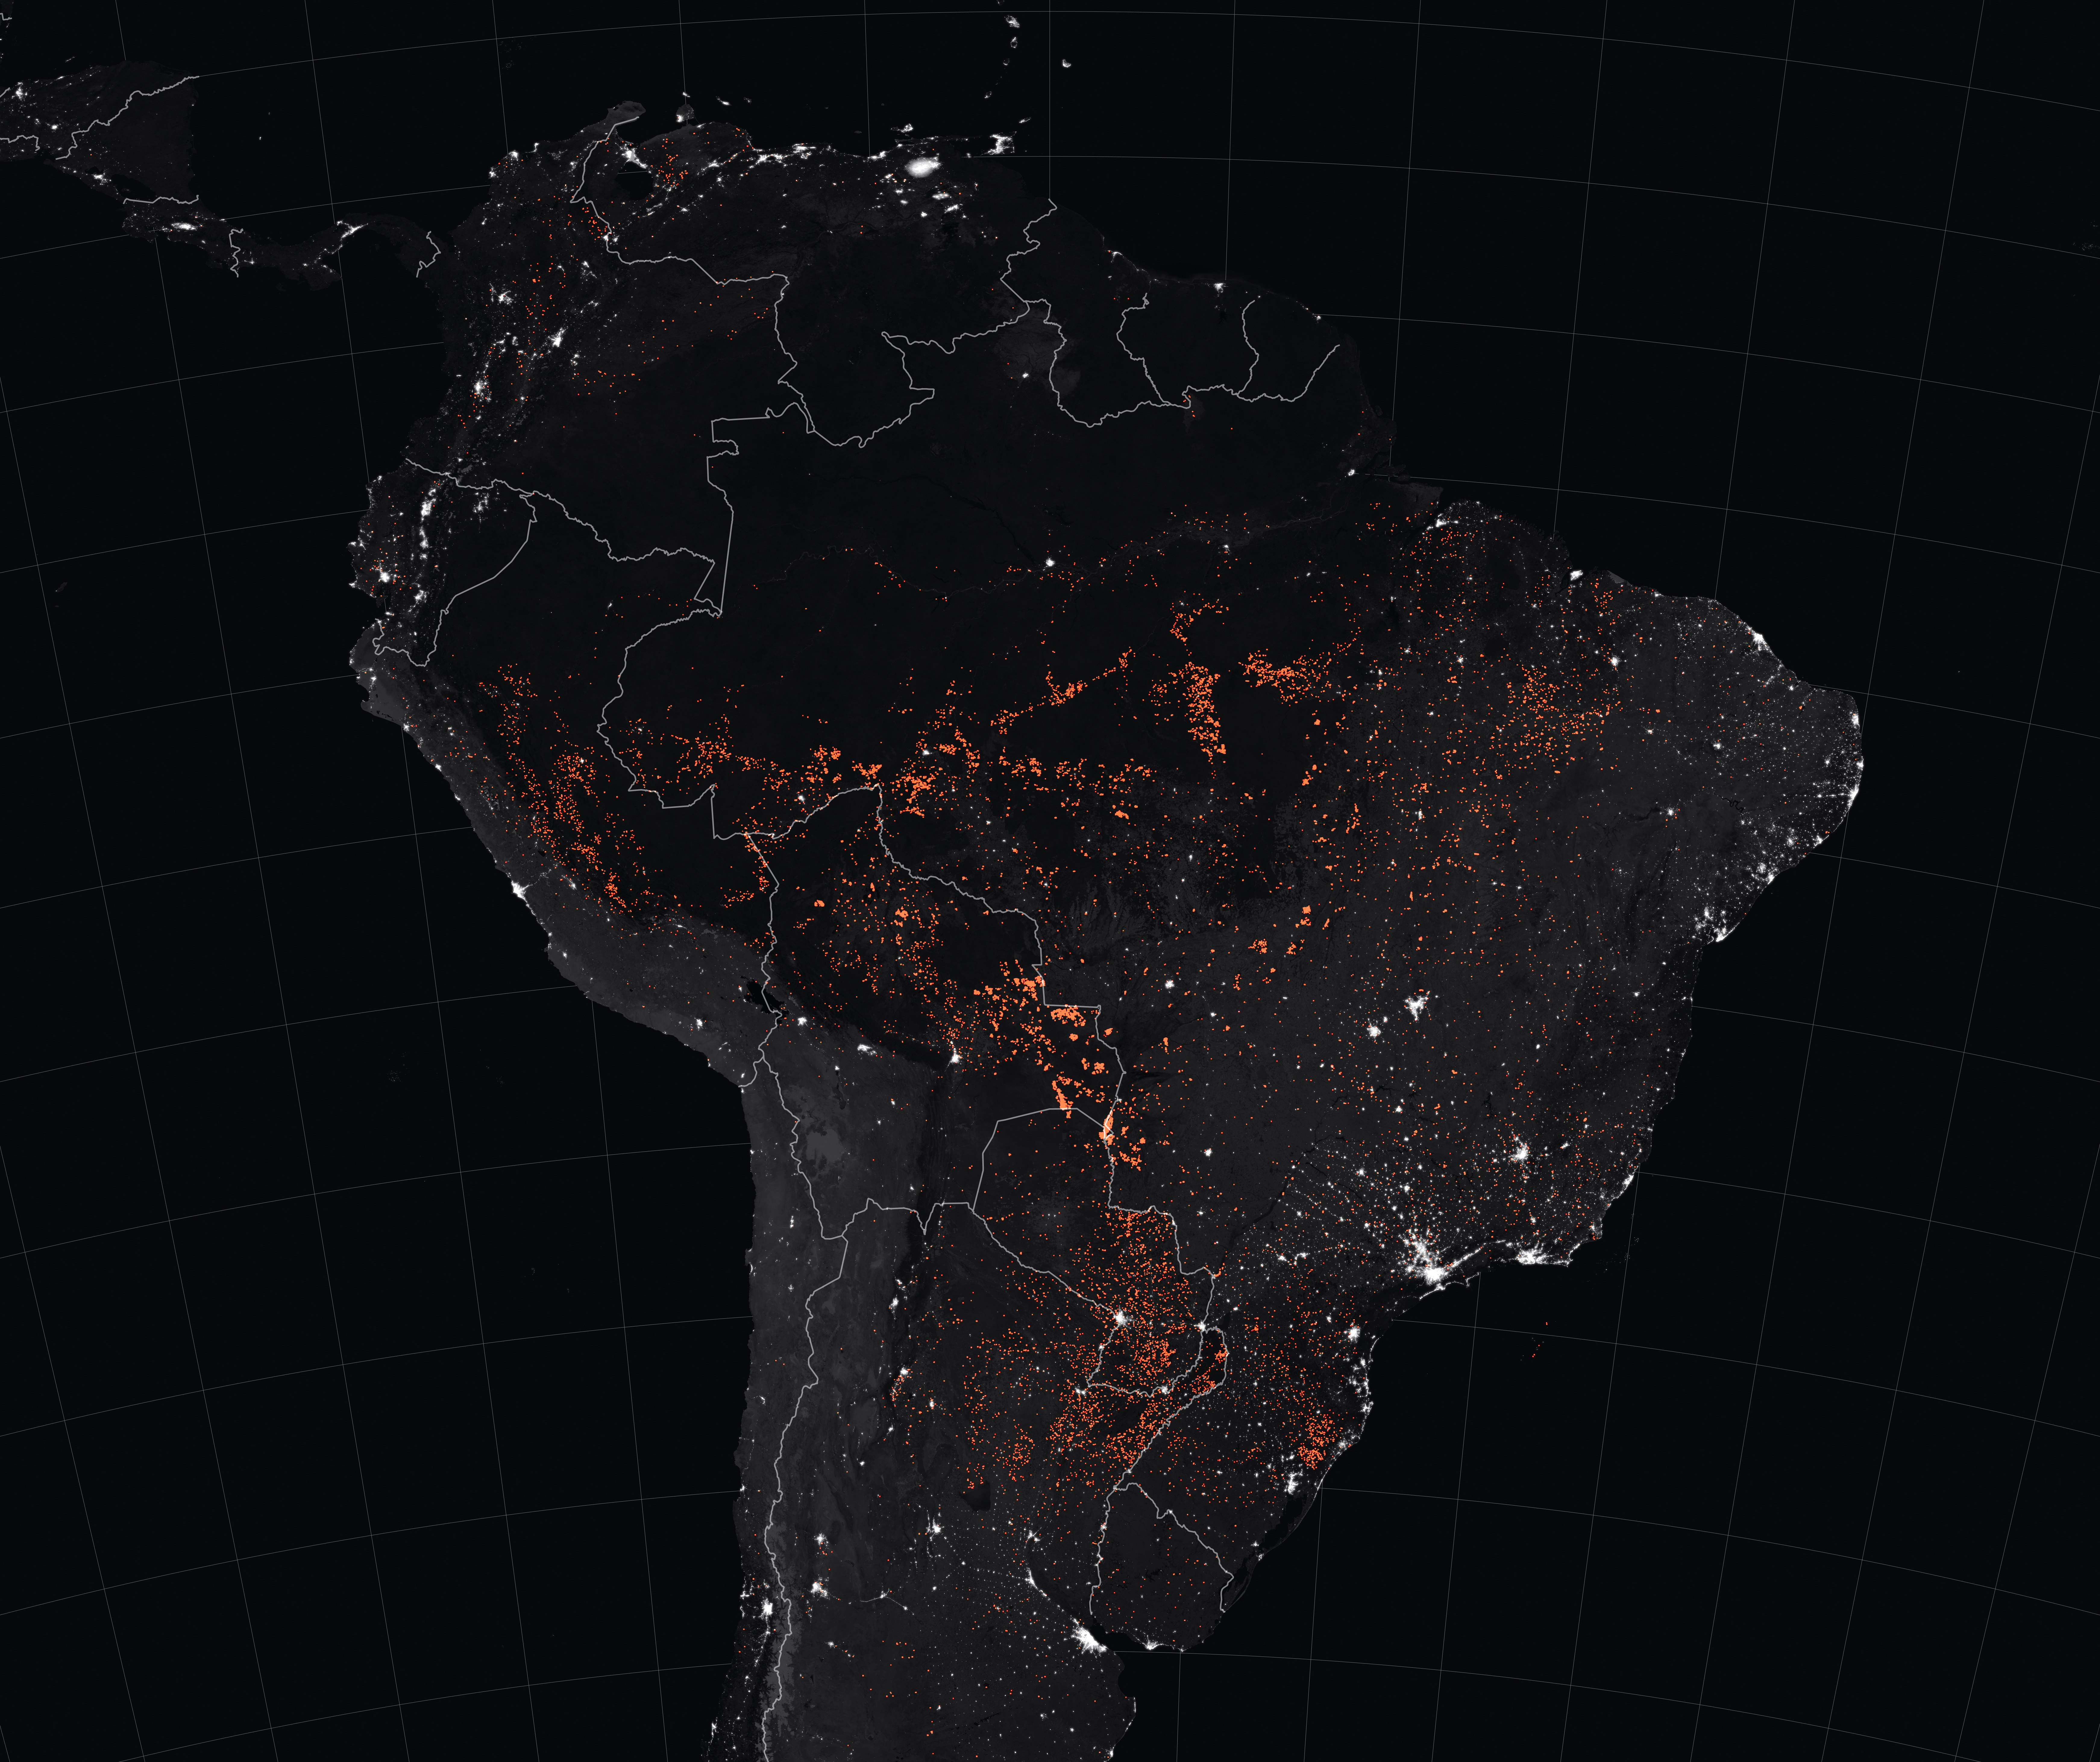
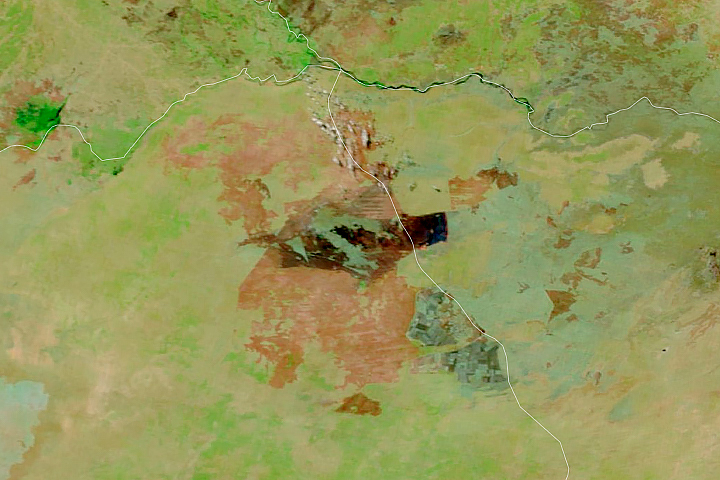
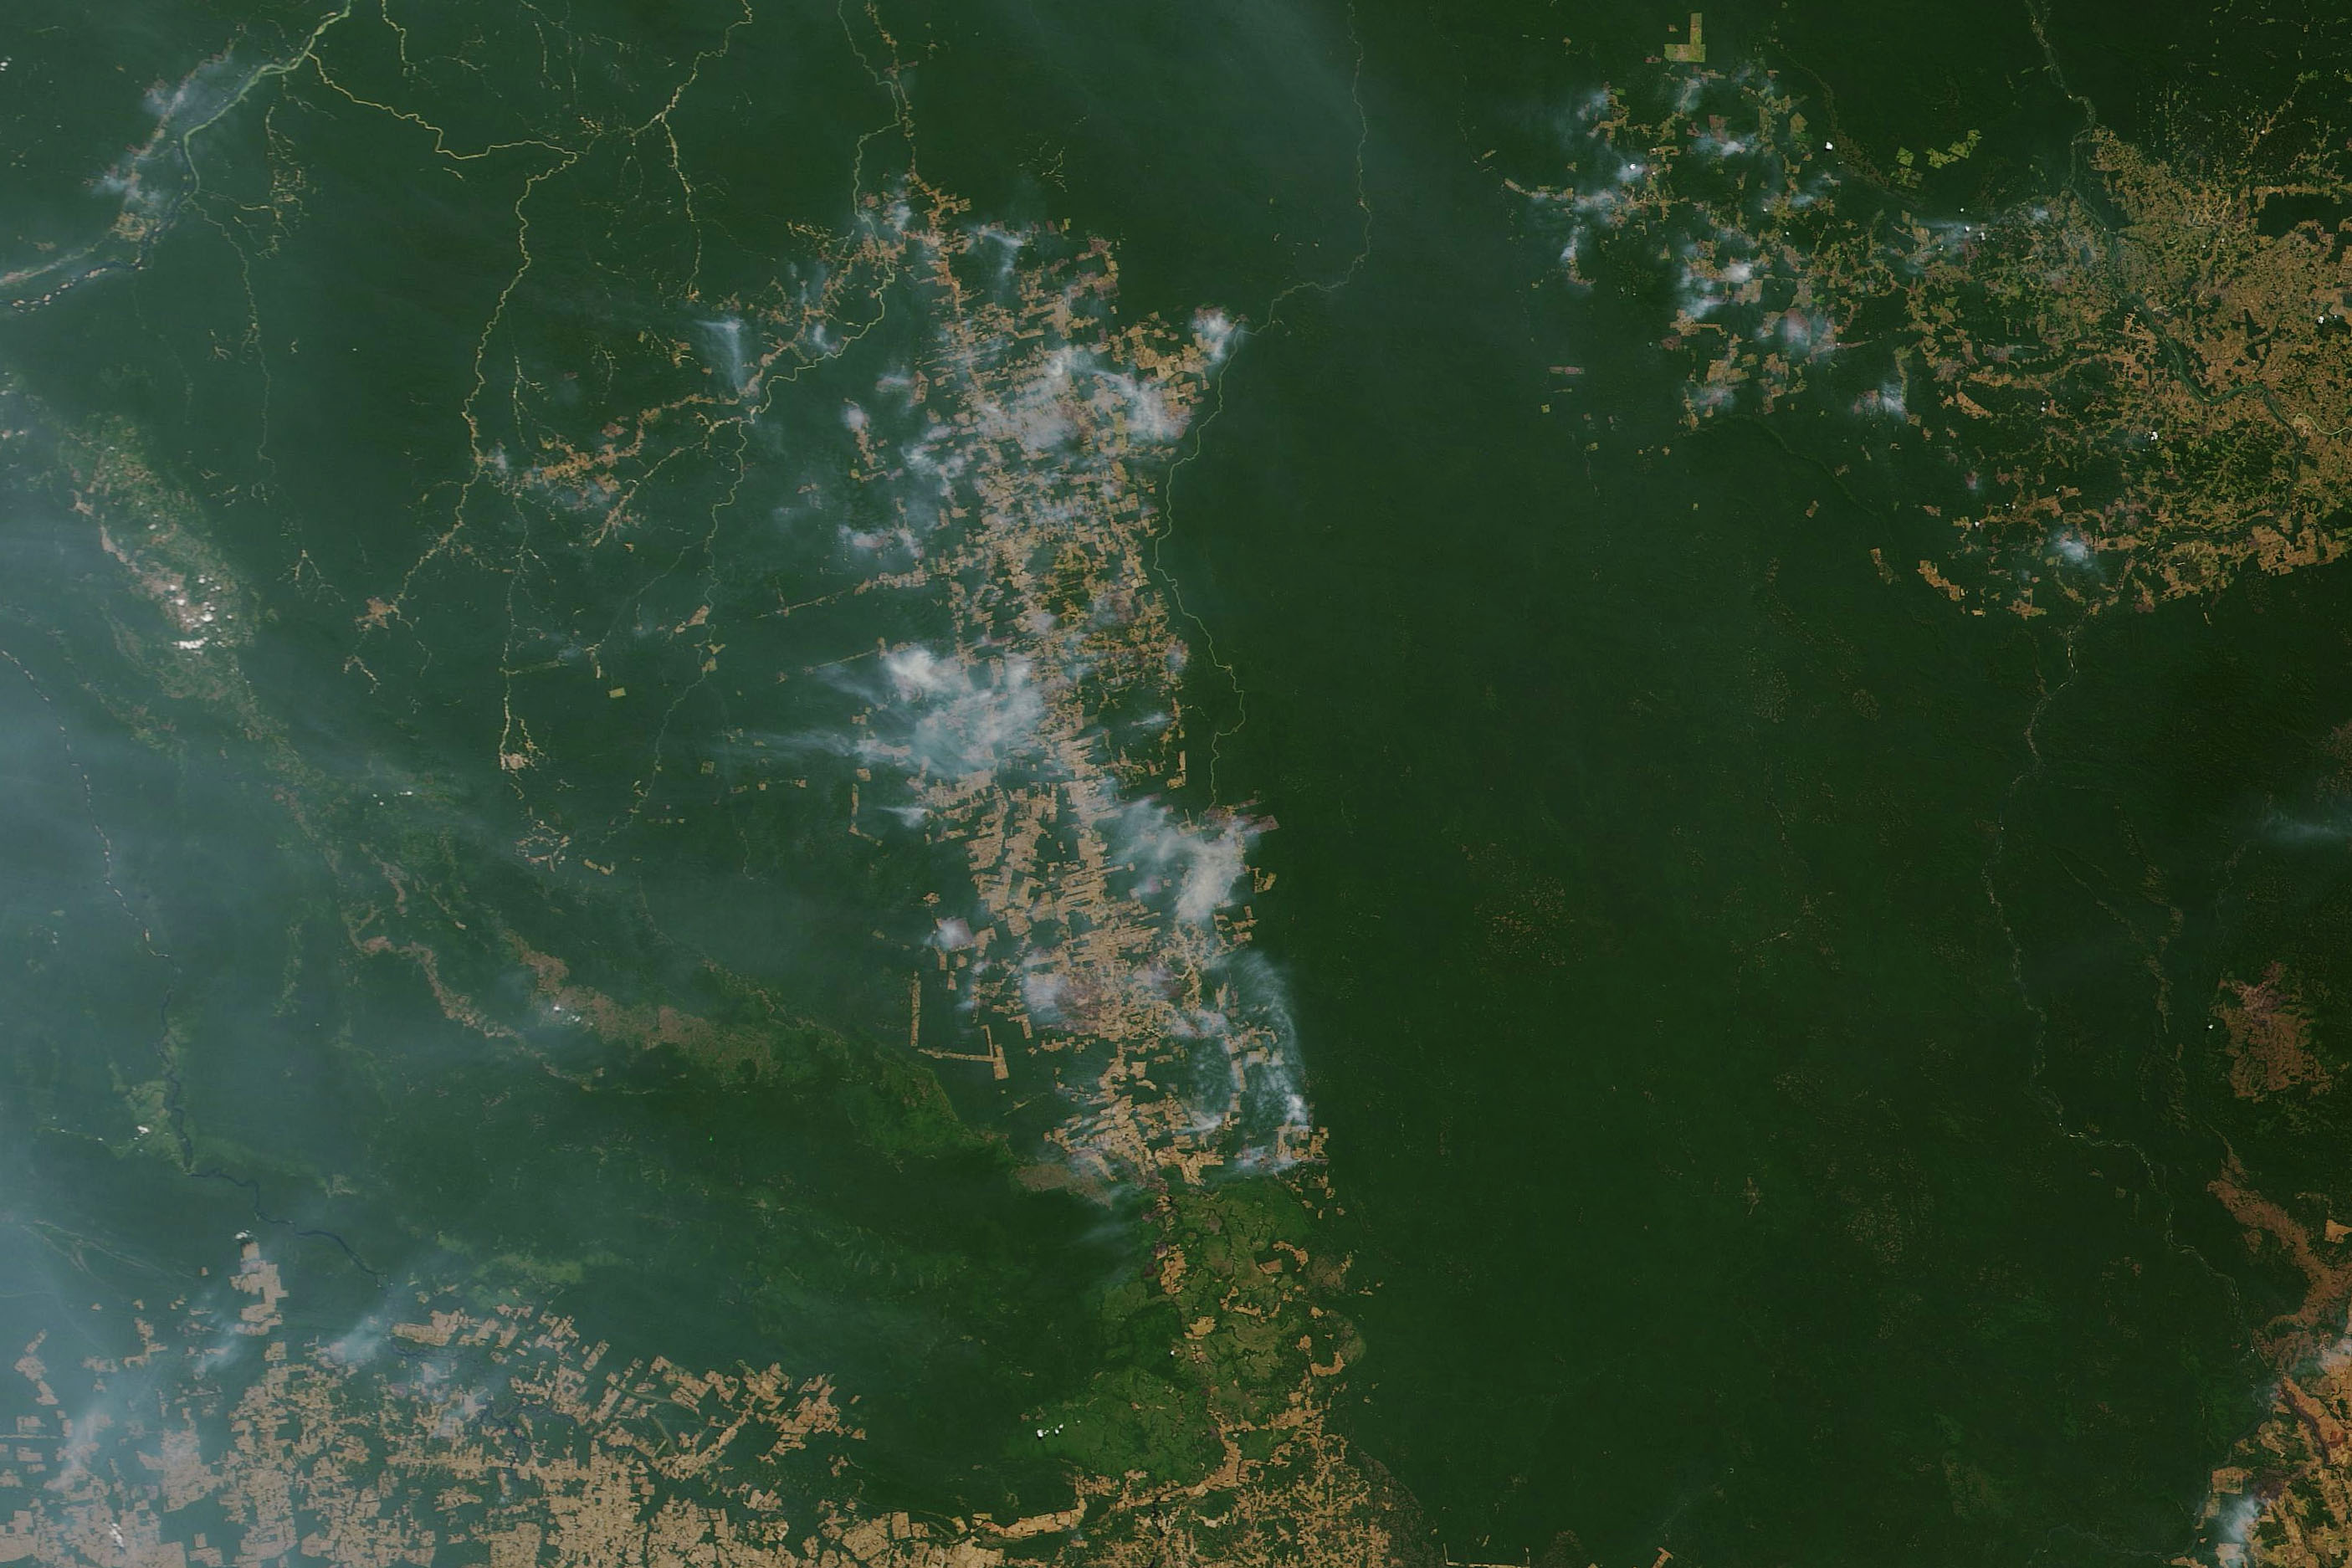
The map above shows active fire detections in Brazil as observed by Terra and Aqua MODIS between August 15-22, 2019. The locations of the fires, shown in orange, have been overlain on nighttime imagery acquired by VIIRS. In these data, cities and towns appear white; forested areas appear black; and tropical savannas and woodland (known in Brazil as Cerrado) appear gray. Note that fire detections in the Brazilian states of Pará and Amazonas are concentrated in bands along the highways BR-163 and BR-230.
Since 2003, MODIS sensors on NASA’s Aqua and Terra satellites have made daily observations of thermal anomalies (usually fires) around the world. The fire detection map on this page is based on data from the Fire Information for Resource Management System (FIRMS), a product developed by the University of Maryland and NASA’s Applied Sciences Program. FIRMS provides near-real-time fire information to natural resource managers and researchers. Note that each point on the map does not necessarily correspond to one fire on the ground. Active fire detections represent the center of a 1 square kilometer area with one or more thermal anomalies. Sometimes one continuous fire can be recorded as multiple anomalies arranged in a line, representing a fire front.
NASA Earth Observatory images by Joshua Stevens, using MODIS data from NASA EOSDIS/LANCE and GIBS/Worldview, Fire Information for Resource Management System (FIRMS) data from NASA EOSDIS, and data from the Global Fire Emissions Database (GFED). Story by Adam Voiland, with information from Douglas Morton (NASA’s Goddard Space Flight Center).