The Earth Observatory has published its last Image of the Day on this website. Please join us on our new home at science.nasa.gov/earth/earth-observatory.

The EO is moving! Join us at science.nasa.gov/earth/earth-observatory

The volcano on Russia’s Kamchatka Peninsula continues to erupt after centuries of quiescence.

The EO is moving! Join us at science.nasa.gov/earth/earth-observatory
Published Dec 2, 2025

In southeastern Libya, Jabal Arkanū’s concentric rock rings stand as relics of past geologic forces that churned beneath the desert.
Published Nov 28, 2025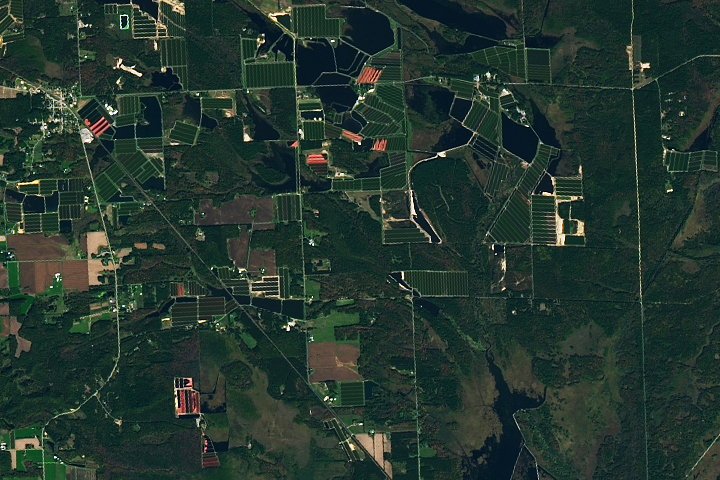
The tart berry and state fruit brings a red pop to holiday feasts—and to satellite images of Midwestern marshlands.
Published Nov 27, 2025
Over millions of years, water has sculpted limestone in northern Vietnam into an extraordinary karst landscape full of towers, cones, caves, and subterranean waterways.
Published Nov 26, 2025
Hurricane Melissa left the island nation’s forests brown and battered, but they won’t stay that way for long.
Published Nov 25, 2025
Satellites are helping land managers track ecological shifts as reserves reconnect and landscapes return to a more natural state.
Published Nov 24, 2025
Late-season reds and browns swept across the Ozark Highlands in the south-central U.S.
Published Nov 21, 2025
A multi-year drought has put extra strain on farmers and water managers in the Middle Eastern country.
Published Nov 19, 2025
Drought in the Nueces River basin is reducing reservoir levels, leaving residents and industry in the Corpus Christi area facing water shortages.
Published Nov 17, 2025
Sea ice around the southernmost continent hit one of its lowest seasonal highs since the start of the satellite record.
Published Nov 17, 2025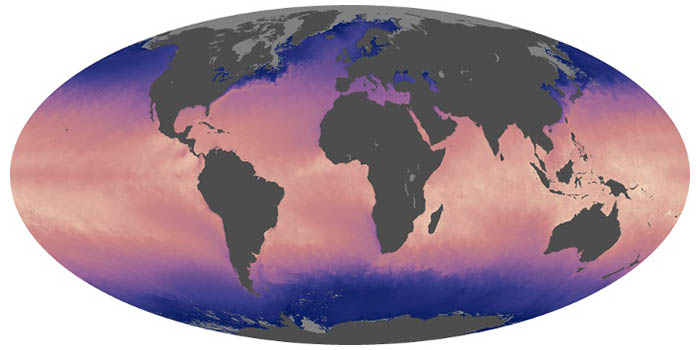
Ocean temperatures can influence weather, such as hurricane formation, and climate patterns, such as El Niño. These maps show the temperature at the surface of the world’s seas and oceans.

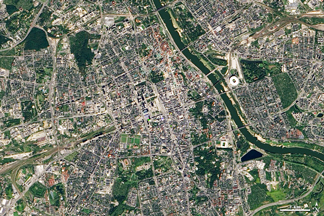
An astronaut photographed the island’s striking mix of mountains, forests, and expanding urban areas.
Published Nov 14, 2025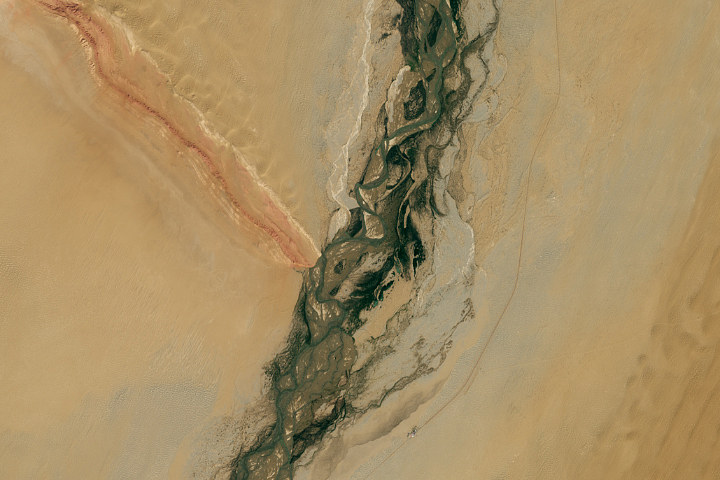
A colorful ridge and winding glacial meltwater river meet amidst dune fields in western China.
Published Oct 1, 2025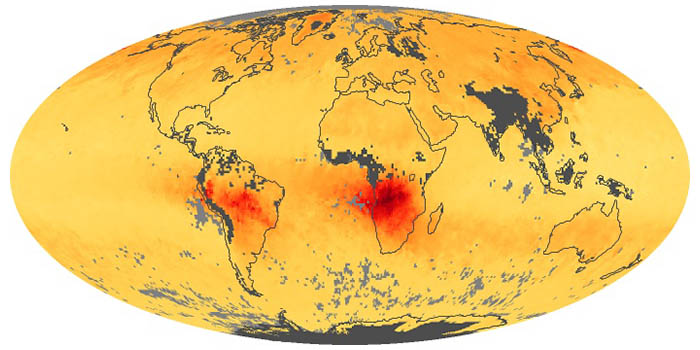
When fuels such as coal, wood, and oil burn incompletely, they produce carbon monoxide. The gas is spread by winds and circulation. These maps show monthly averages of CO in the lower atmosphere.
What do you do when presented with a new satellite image? Here's what the Earth Observatory team does to understand the view.
Published Nov 18, 2013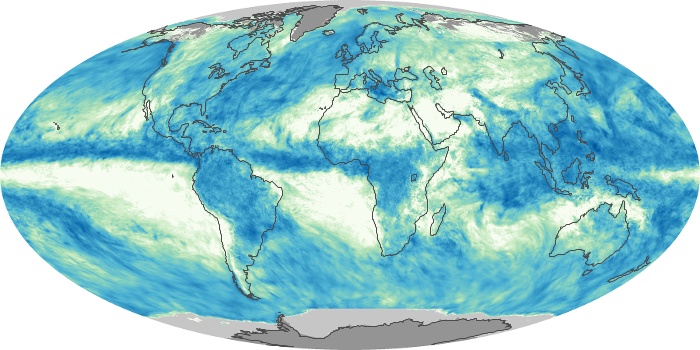
These maps depict monthly total rainfall around the world. Rainfall is the primary source of fresh water for humans, plants, and animals. Rain also moves heat between the atmosphere, oceans, and land.
Have you ever wondered what it would be like to live in a different part of the world? What would the weather be like? What kinds of animals would you see? Which plants live there? By investigating these questions, you are learning about biomes.
Published Aug 28, 2020
The tropical cyclones are close enough in proximity that they may influence one another.
Published Sep 29, 2025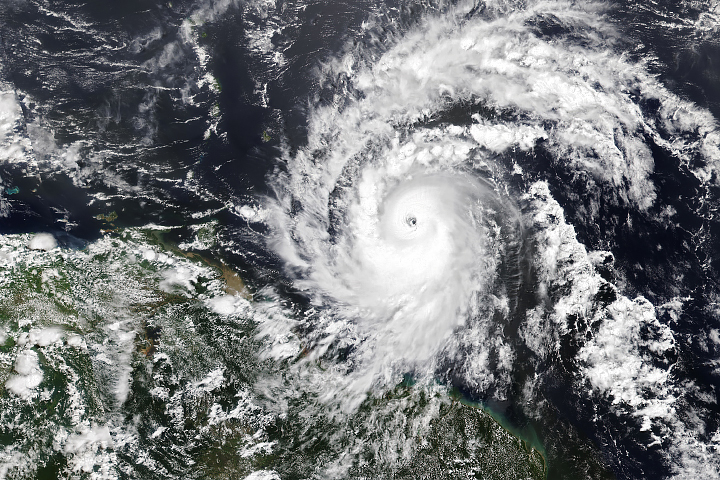
Hurricane season in the basin runs from June 1 to November 30.
Published Jul 1, 2024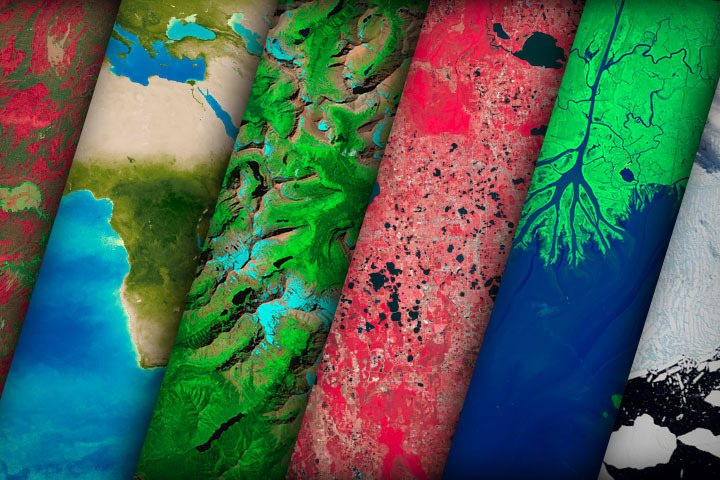
NASA satellites document how our world—forests, oceans, human landscapes, even the Sun—changes over months, seasons, and years.
Published Apr 29, 2009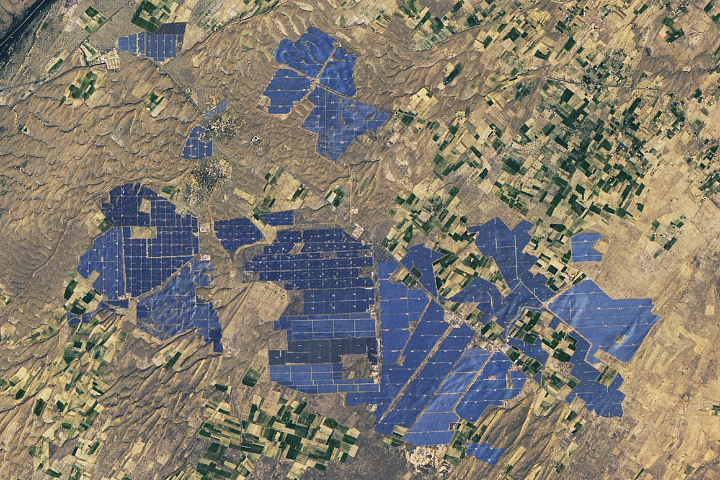
People have developed systems to harvest and store energy from sources such as wind, sunlight, and tidal action. Many of these installations are visible from orbit.
Published May 10, 2024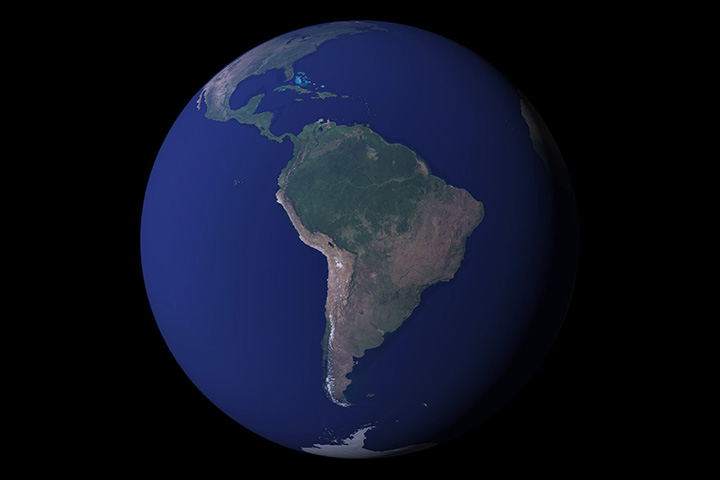
12 months of high-resolution global true color satellite imagery.
Published Oct 13, 2005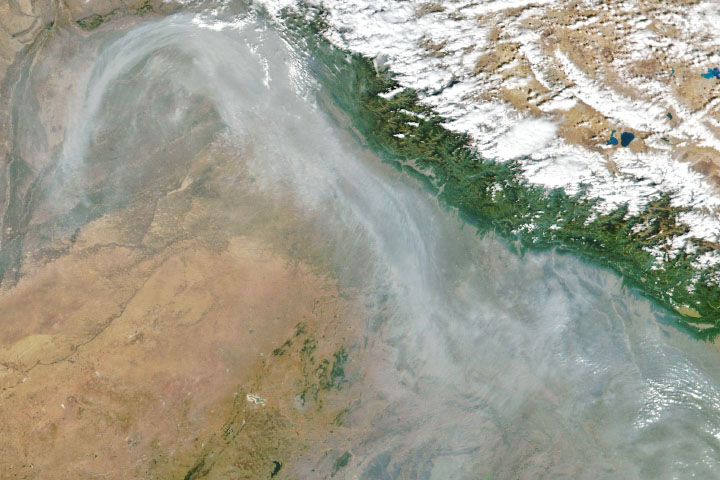
From ground-level ozone to particulate matter to nitrogen dioxide, an array of gasses and particles can affect the air people breathe, with implications for human health.
Published Apr 8, 2024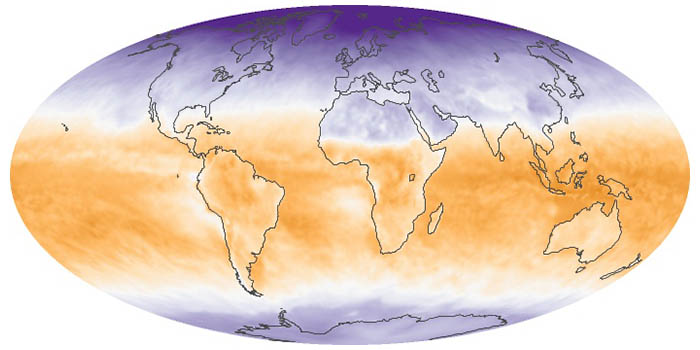
Net radiation is the balance between incoming and outgoing energy at the top of the atmosphere. It is the total energy available to influence climate after light and heat are reflected, absorbed, or emitted by clouds and land.
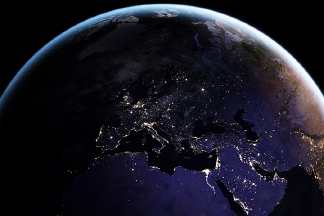
Satellite images of Earth at night have been a curiosity for the public and a tool of fundamental research for at least 25 years. They have provided a broad, beautiful picture, showing how humans have shaped the planet and lit up the darkness.
Published Apr 12, 2017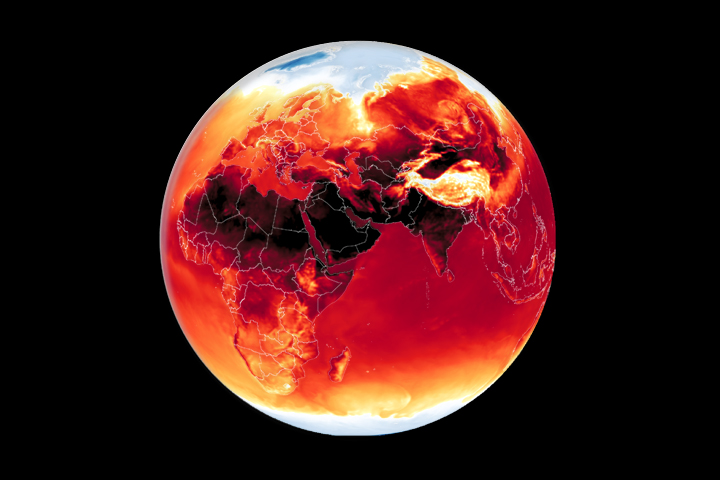
Warmer-than-average temperatures are showing up locally and globally, with consequences for people, landscapes, and ecosystems.
Published Mar 26, 2024
Whether sparked by lightning, intentional land-clearing, or human-caused accidents, wildland fires are burning longer and more often in some areas as the world warms.
Published Feb 27, 2024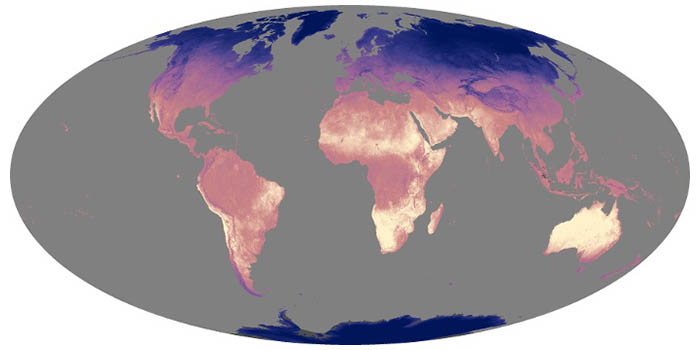
Land surface temperatures rise and fall with the heat of the Sun, and they represent how hot or cold the surface would feel to touch. These maps show daytime land temperatures as measured from space.
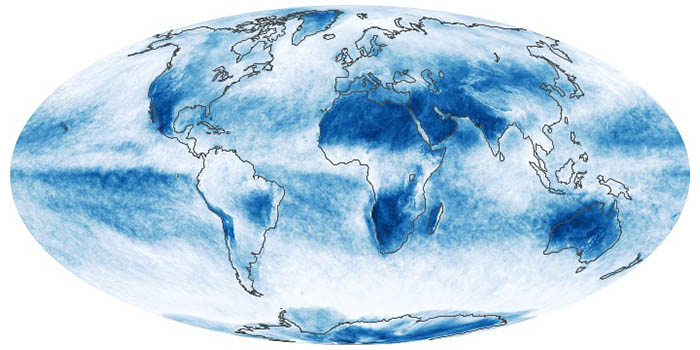
In addition to making rain and snow, clouds can have a warming or cooling influence depending on their altitude, type, and when they form. These maps show what fraction of an area was cloudy each month.