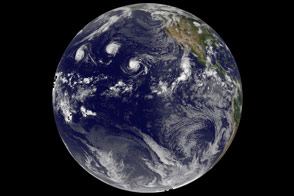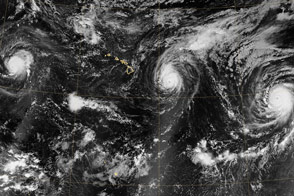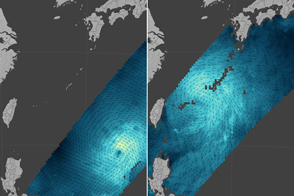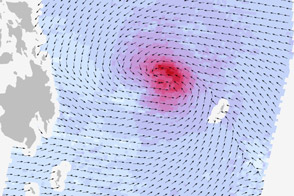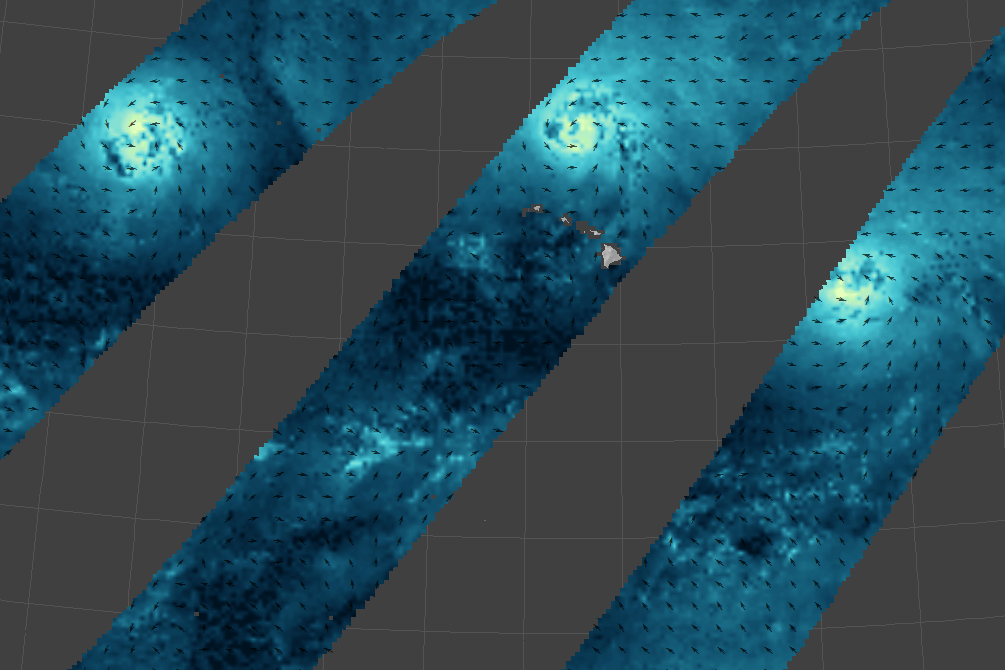
The trio of tropical cyclones that marched across the Pacific Ocean in late summer 2015 was shown in satellite imagery acquired at nighttime, and again in the daytime when a fourth storm joined the line up. The map above adds yet another view, showing the storms’ wind fields.
The map was generated from data acquired on September 2, 2015, by the International Space Station-Rapid Scatterometer (ISS-RapidScat). The storms on this day included one typhoon (Kilo), one hurricane (Jimena), one tropical storm (Ignacio).
The map is a combination of three passes acquired from between 14:45 and 19:20 Universal Time (4:45 a.m. and 9:20 a.m. Hawaii Standard Time). Arrows represent the direction of near-surface winds. Shades of blue indicate the range of wind speeds (lighter blue and green represent faster-moving winds).
ISS-RapidScat works by reflecting microwave pulses off the ocean surface and back toward the sensor. Rough waters—those disturbed more by wind—return a stronger signal than smooth waters. From that information, scientists can derive wind speed, as well as its direction based on the position of the waves. The nature of this measurement method means RapidScat is describing the winds close to the ocean’s surface. Higher up in a storm, winds can be even faster.
NASA Earth Observatory map by Joshua Stevens, using RapidScat data from the Jet Propulsion Laboratory. Caption by Kathryn Hansen.