This Image of the Day includes excerpts from the new feature story: Big Data Helps Scientists Dig Deeper.
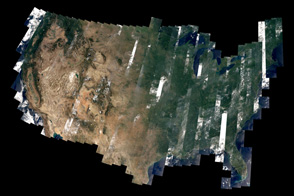
For most of the 43 years that Landsat satellites have been in orbit, remote sensing research has been a slow and sometimes expensive slog. Images of Earth had to be pieced together by hand and sorted by eye, and views marred by even a bit of cloud cover were tossed aside. Scenes were requested in small batches because each one came with a fee (as much as $4,400 apiece). A lot of data was left unconsidered because of the costs in time and dollars. Until 2008, only 4 percent of the Landsat archive had even been examined.
But two things have changed in the past decade. First, computing power has grown exponentially and has become more accessible for researchers. Software and hardware have made it significantly easier to search and analyze data, allowing students and scientists to spend more time thinking and less time sorting. And second, the Landsat archives were thrown open in January 2009 and made freely available to the public. A vast mine of more than 50 trillion pixels of Earth imagery was suddenly available for scientists and citizens to dig into. The changes brought Landsat into the era of “big data.”
“YouTube did a major machine learning (analysis) of the corpus of YouTube videos, and they found that there are a lot of cats,” noted Rebecca Moore, a Google employee who has collaborated on several Landsat-based research and mapping projects. Such analysis is just one example of a growing phenomenon known as “big data,” in which computers crunch vast quantities of information to identify useful patterns that might otherwise get overlooked. Moore thought: What patterns would emerge if you applied the big data approach to Earth imagery?
That’s a question Earth scientists also have been asking. Dating back to 1972, seven satellites’ worth of Landsat images contain enough detail to show the impact of human decisions on the land. With at least one image of every land-based location per year, the Landsat record provides the longest continuous view of Earth’s landscape from space. “With the full Landsat record available, we can finally look at really big problems,” said Jeff Masek, the Landsat 7 project scientist and a researcher at NASA’s Goddard Space Flight Center.
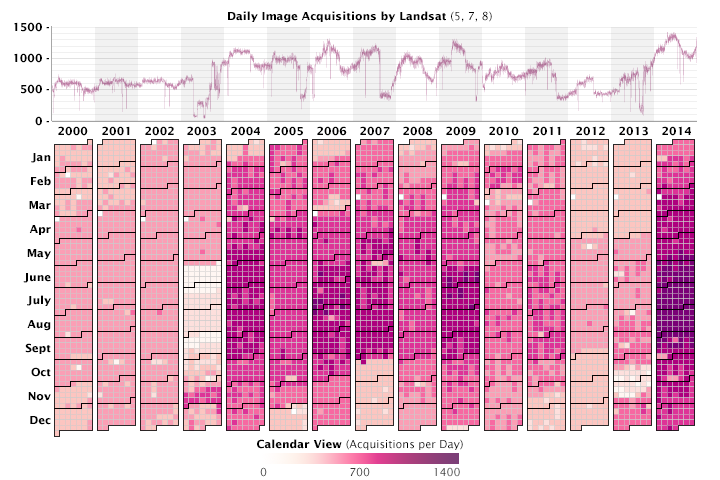
The graph above shows daily image acquisitions by Landsat satellites from 2000 through 2014. Deeper purples show days with the most acquisitions, while light pinks and whites are days with little to no coverage. Since January 2000, Landsat 5, 7, and 8 have acquired more than 4.3 million scenes that have been used for everything from monitoring deforestation to neighborhood advocacy to glacier research.
At certain times of year, as many as 1,400 scenes can be acquired in a day. In recent years, Landsat 7 has averaged 350 scenes per day, while Landsat 8 (launched in February 2013) regularly produces 725 per day. Periods with fewer acquisitions are sometimes due to hardware failures or issues with communications or limits on the number of ground stations available to receive data (since Landsat 5 did not have onboard storage). The number of acquisitions increases substantially from April through October of each year—the northern hemisphere growing season—because agricultural interests such as the U.S. Department of Agriculture are key consumers of the data. There’s also more land in the northern hemisphere and more summer daylight hours for capturing scenes all the way to the Arctic.
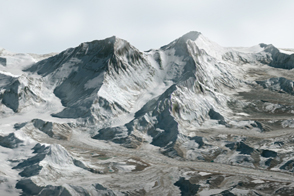
Because a Landsat satellite flies over every parcel of land on Earth every sixteen days (and sometimes every eight), it is possible to detect even subtle change in the landscape between seasons and between years. The animation below shows the area around Union Peak and Crater Lake in Oregon as observed by Landsat 5, 7, and 8 in late summer between 2000 and 2014.
Note the forest clearing and other land use changes, particularly in the lower left and lower right portions of the scene. Forests also appear browner or greener in wetter and drier years. (There are minor differences in lighting, too.) The time series also captures several wildfires near the lake, as well as the creation and healing of burn scars.
Scientists like Masek and Robert Kennedy (Boston University) see the potential of Landsat data to unravel mysteries like the global carbon cycle on both macro and micro levels. “You can look at changes over time and you can see how one process affects another,” said Kennedy. “We are now able to ask questions about where, when, and why two processes interact.”
“We are doing statistics on the planet,” added Moore. “I’m really curious to see what people find in all of this satellite data.”
To learn more about new techniques for mining the Landsat archive, read our feature story: Big Data Helps Scientists Dig Deeper.
Earth Observatory images by Joshua Stevens using Landsat data from the U.S. Geological Survey. Caption by Holli Riebeek and Mike Carlowicz.