The Enhanced Thematic Mapper Plus (ETM+), the sole instrument on the Landsat 7 satellite, is far more than a camera. While a typical point-and-shoot digital camera takes one picture of a scene based on information from the visible portion of the electromagnetic spectrum, the ETM+ generates eight separate views of everything it images.
The ETM+ senses electromagnetic radiation in seven different bands, plus an additional panchromatic band that combines a broad range of wavelengths to create a high-resolution image. Three of them (bands 1, 2, 3) are in the visible portion of the spectrum and correspond to blue, green, and red light. The other four bands (4, 5, 6, 7) fall in the infrared portion. Band 4 is near infrared, with a slightly longer wavelength than visible light. Bands 5 and 7 are longer still, in the shortwave infrared portion of the spectrum. Band 6 detects thermal infrared radiation, or radiant heat. Band 8 is the broad panchromatic band that incorporates visible and infrared light. Researchers can combine three of the six visible, near infrared, and shortwave infrared bands to generate different types of natural-color and false-color images.
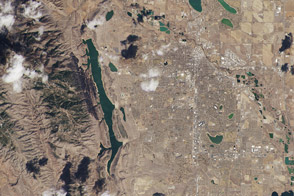
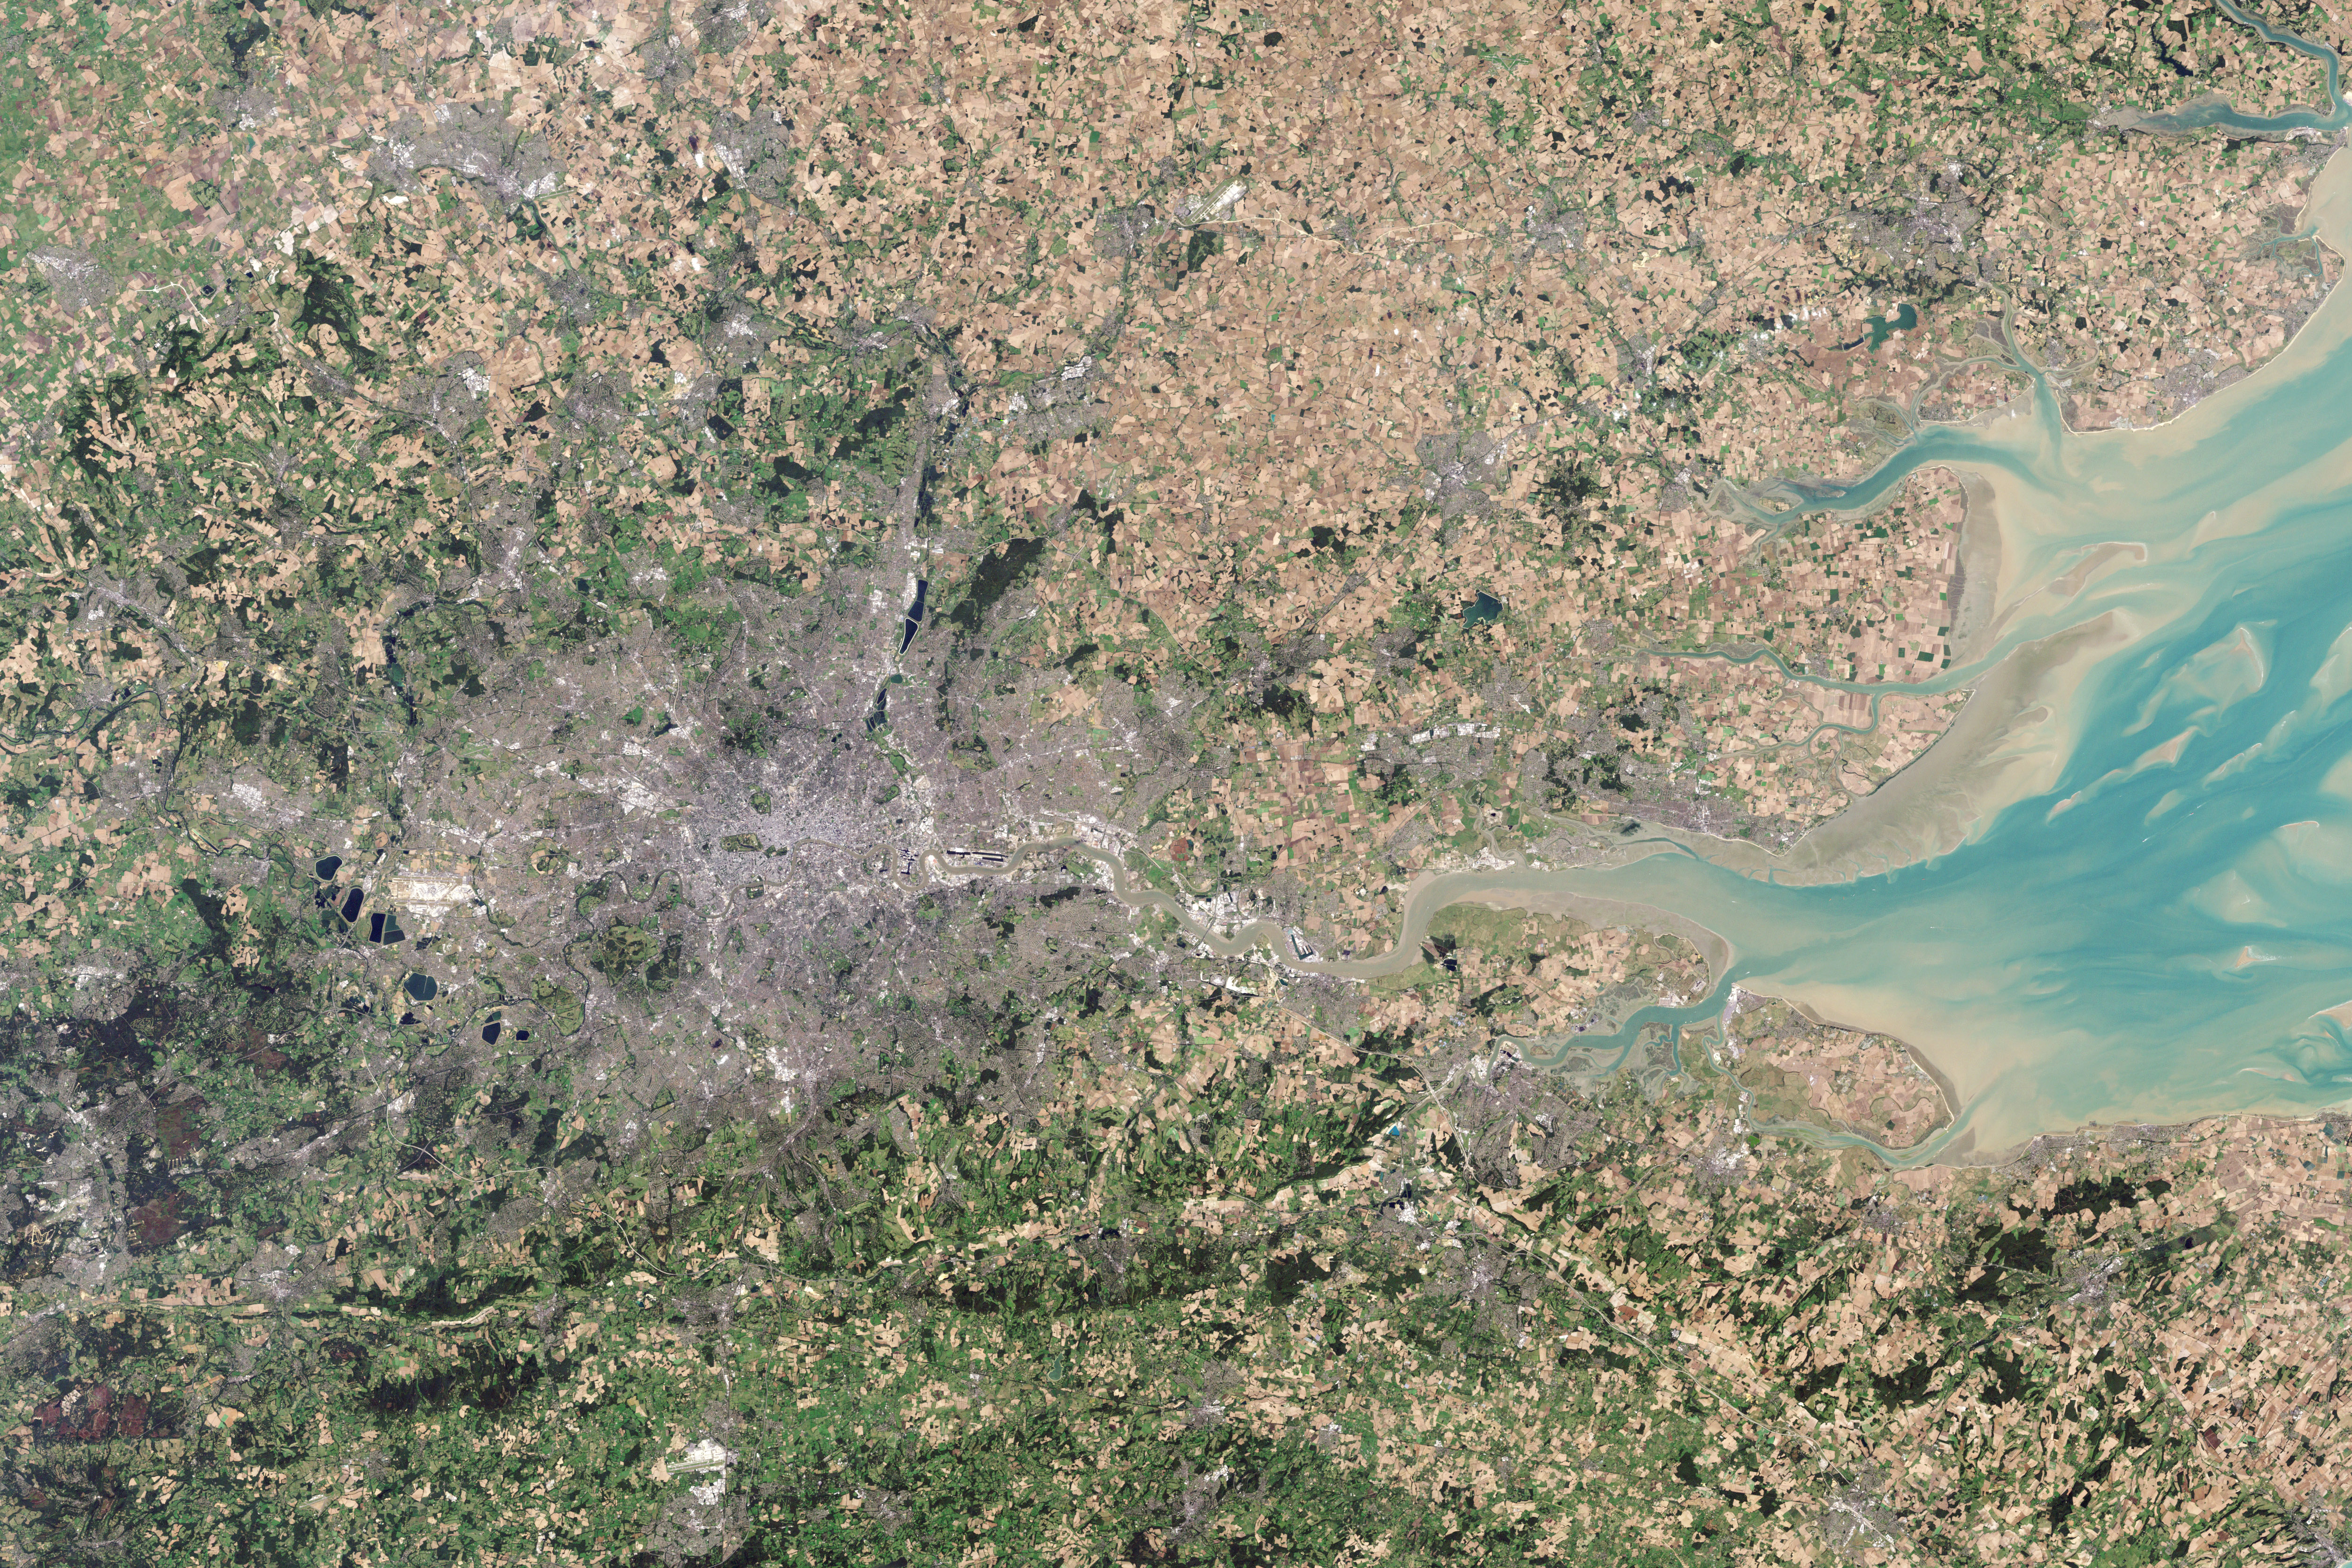
Combining the three visible bands produces a natural-color view, such as the top image of London. Natural-color images look familiar to human eyes: the canopy of Epping Forest is green; the reservoirs near Heathrow Airport are dark blue; and the city itself is gray. Natural-color images offer the best view of city infrastructure, sediment, and bathymetry. However, it can be difficult to distinguish between different types of vegetation and between clouds and snow.
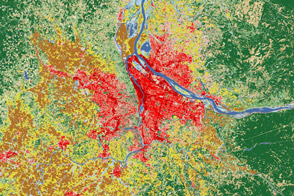
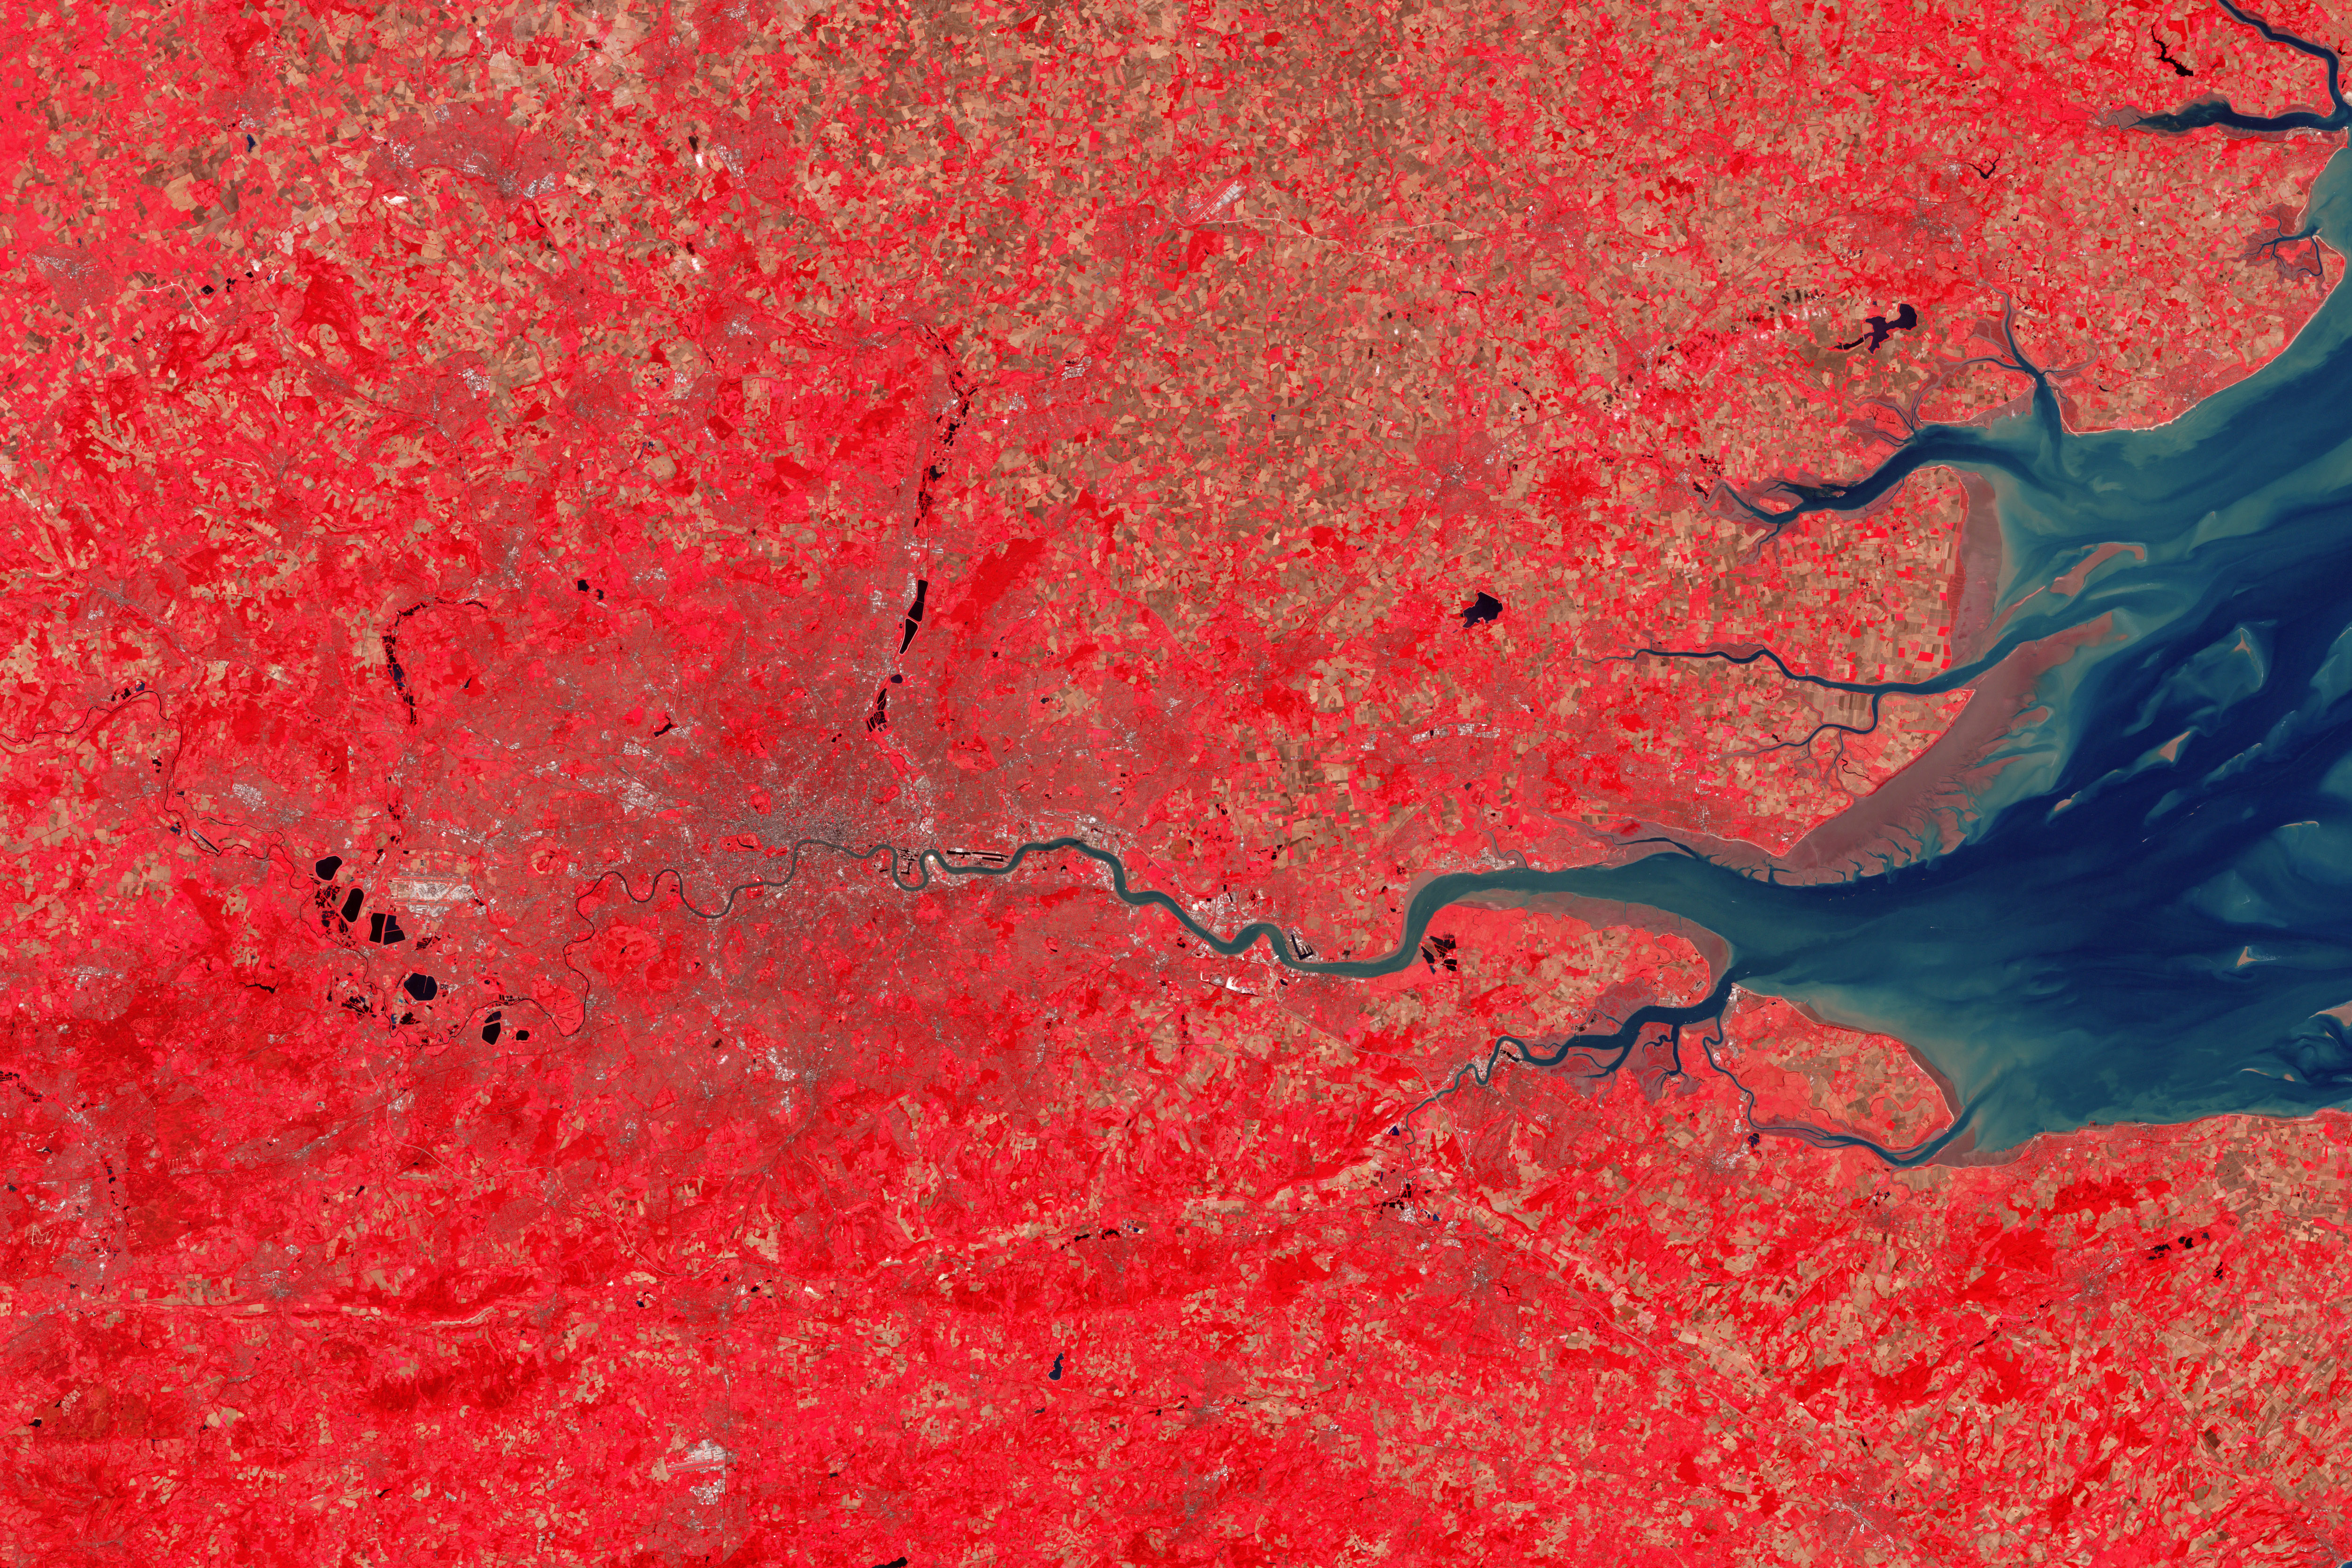
In the middle image, data from one of the infrared bands (4) has been combined with the green (3) and blue (2) bands to create a 4-3-2 false-color view of London. This is a widely-used combination that is especially useful for studies of vegetation, as different types and densities of plants reflect infrared light in different ways. Coniferous forests, for example, appear darker red than hardwoods. Also, deep red hues indicate dense vegetation, while lighter reds indicate grasslands or sparsely vegetated areas.
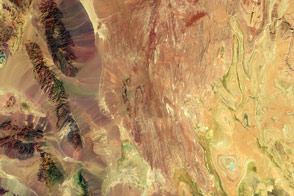
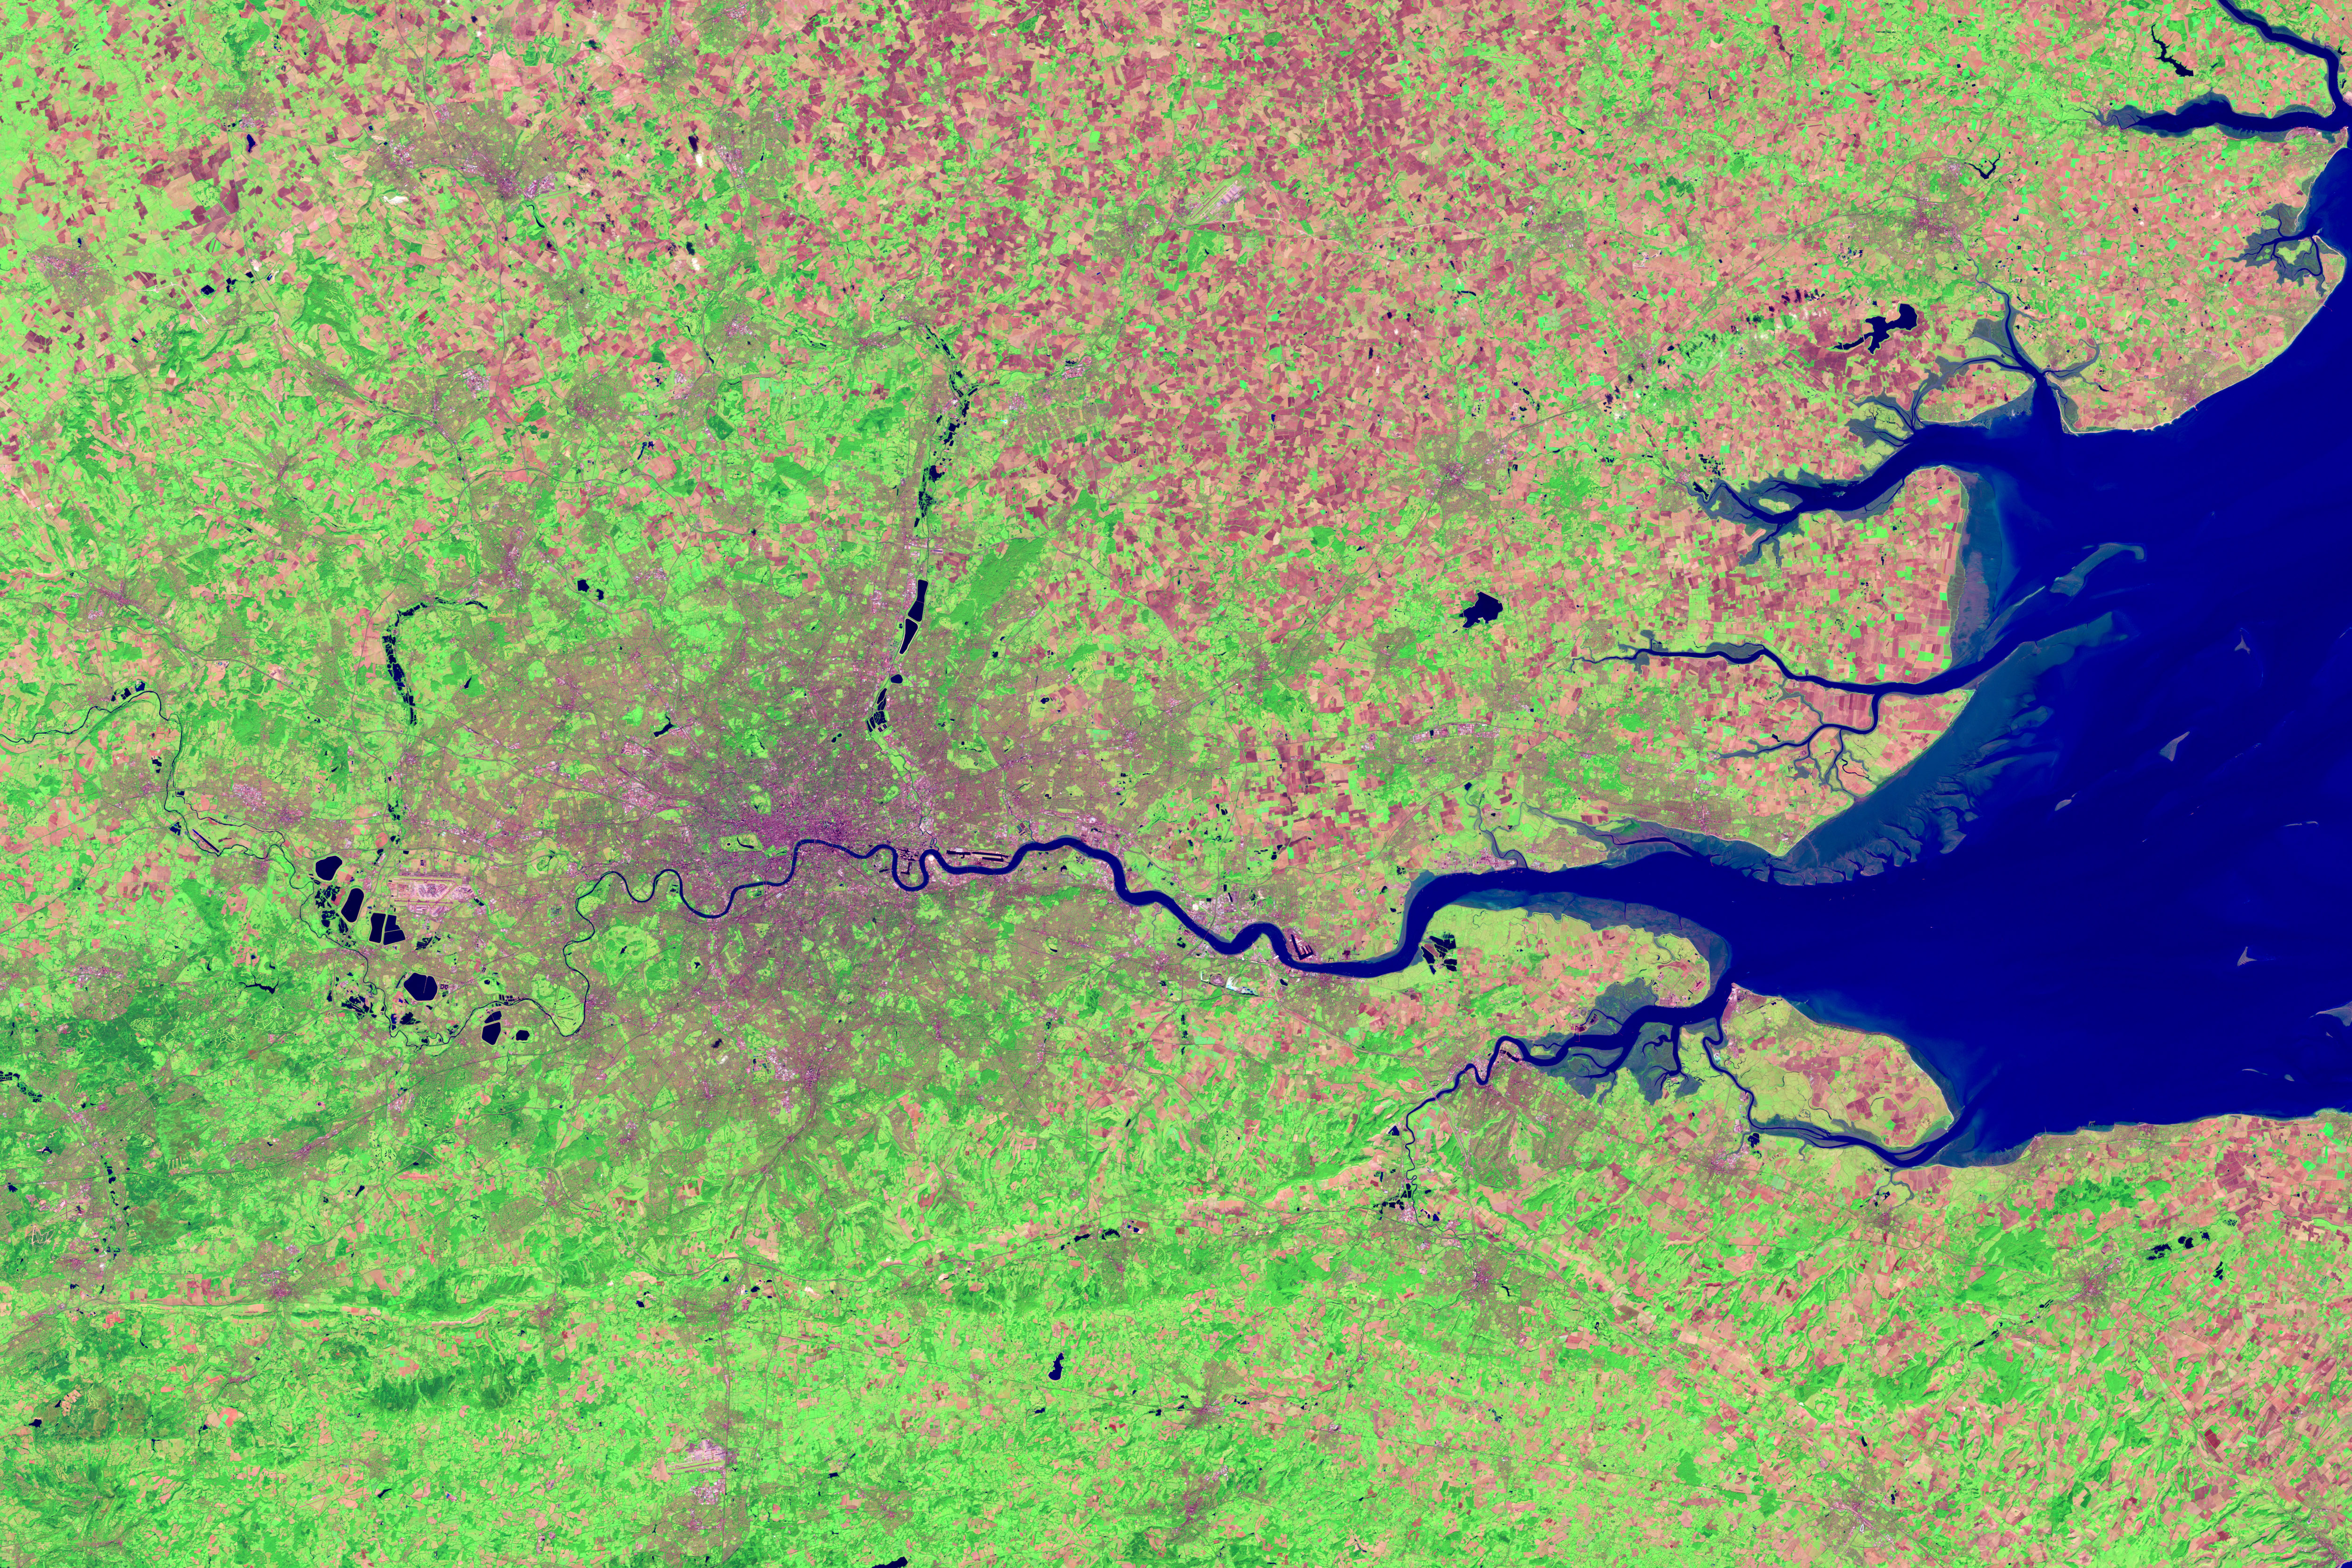
The bottom image is another type of false-color image made from a combination of bands 7, 4, and 2 (two infrared bands plus green). This combination is especially useful for geological, agricultural, and wetlands research because band 7 can help discriminate between various rock and mineral types. Bright green spots indicate vegetation and the waters appear dark blue or black. Urban areas appear as gray or pink, while cleared fields appear tan or purple.
NASA Earth Observatory images by Robert Simmon, using Landsat data from the USGS Global Visualization Viewer. Caption by Adam Voiland.