To know whether Antarctic ice could be melting or growing in response to global or regional climate change, scientists must make precise measurements of the area and thickness of the continent’s ice sheets and ice shelves. One approach for estimating ice thickness is to measure the height of the ice surface from satellites using radar or lasers. Because ice shelves stretch from the land into the water, their height can appear to change as they are raised or lowered by the tides. To get a true picture of the ice thickness, scientists must cancel out the effect of the tides on their measurements, but tidal information for Antarctica is scarce. Recently scientists used satellite-based observations of changes in the Earth’s gravitational field to map tidal cycles around Antarctica.
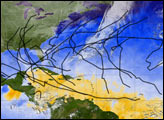
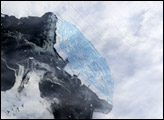
This image shows the twice-daily, lunar tide amplitudes in the Southern Ocean around the Antarctic Peninsula (located at 60 degrees West) based on data collected by the satellite-based Gravity Recovery and Climate Experiment (GRACE) between August 2002 and June 2004. (Tide amplitude is one-half of the difference in water level between high tide and low tide; in other words, it is the distance the tide rises above and then falls below the baseline water level.) In this image, the amplitude of the tide is shown in different colors, from blue (smallest tides) to white (largest). The largest amplitudes occur beneath the Ronne-Filchner Ice Shelf, where the tide amplitude reaches 30 centimeters. In that location, the difference between high and low tide would be 60 centimeters (about 2 feet). These values represent the average tidal changes over a large area. At individual locations, the tide variation may be even more extreme. Even though Antarctic ice shelves can be up to about 1.6 kilometers (1 mile) thick in places, tides can lift these shelves as much as 4.5 meters (about 15 feet).
A joint partnership of NASA and the German Aerospace Center, GRACE consists of two identical spacecraft that fly in the same orbit, separated by roughly 220 kilometers (137 miles). The shifting of mass across the Earth’s surface, such as the movements of large masses of water during tides, makes tiny changes in Earth’s gravitation field. Changes in the Earth’s gravity cause the distance between the twin satellites to increase or decrease. The two satellites can measure the changing distance between them to within one-hundredth of the width of a human hair. Scientists translate the changes in distance between the satellites into changes in gravity, and then estimate the amplitude of the tide that would be required to produce the observed change in the Earth’s gravitation field.
Besides enabling researchers to better assess how much of any observed changes in the height of the ice surface is actually due to tides rather than to changes in ice volume, data from the GRACE experiment have provided other useful information. Not only do tides raise and lower ice shelves, they can eat away the ice shelves from underneath. Such tidal activity may have played a role in ice shelf loss, such as the calving of the Larsen Ice Shelf in 1995. GRACE has also provided information on the location of grounding lines, the place where the underside of the ice shelf parts with the land surface and is underlain only by water. C.K. Shum, one of the researchers on this project, suspects that the previous placements of grounding lines have been off by hundreds of meters.
Images courtesy Ohio State University