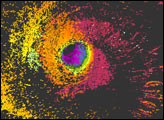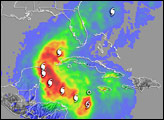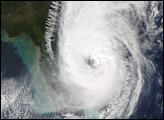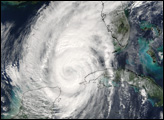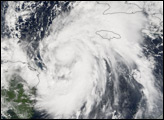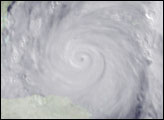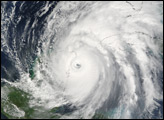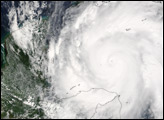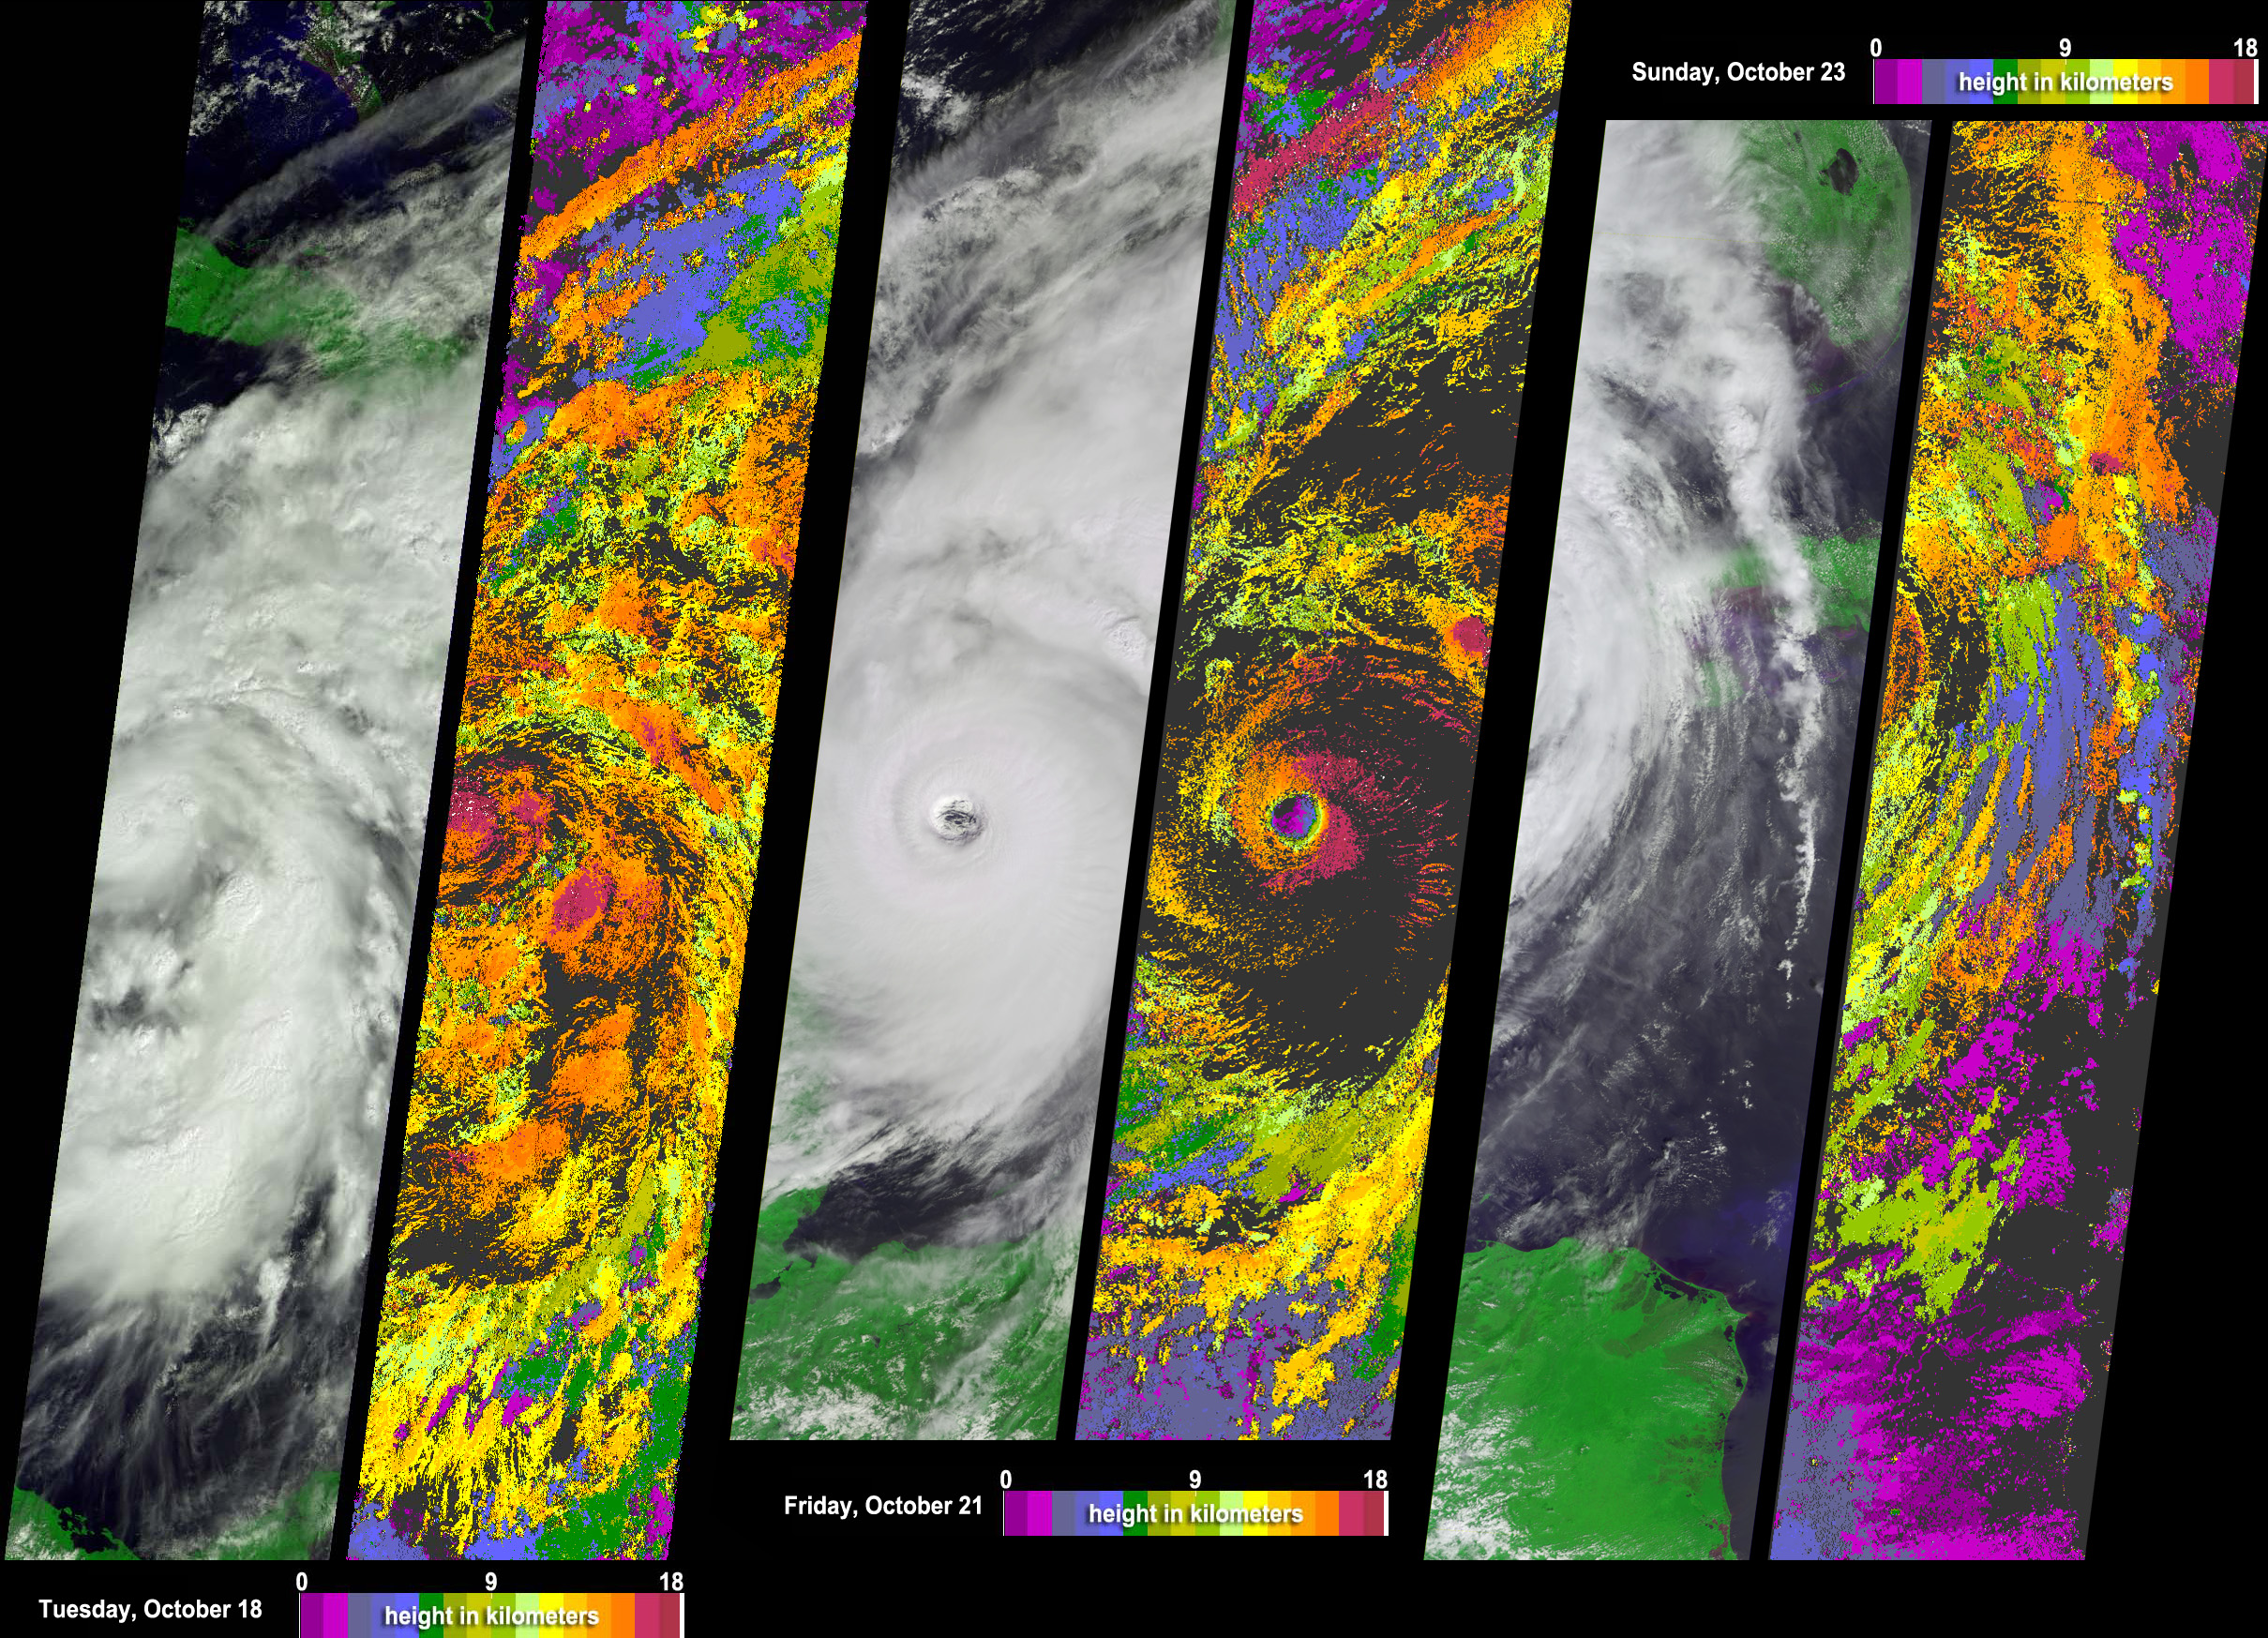
Information on cloud-top heights at different stages in the life cycle of the rapidly intensifying Hurricane Wilma may prove useful for evaluating the ability of numerical weather models to predict the intensity changes of hurricanes. NASA’s Multi-angle Imaging SpectroRadiometer (MISR) acquired this sequence of images and cloud-top height observations for Hurricane Wilma as it progressed across the Caribbean in October 2005. Each pair in the sequence has a photo-like view of the storm on the left and a matching color-coded image of cloud-top height on the right. Cloud-top heights range from 0 (purple) to 18 (red) kilometers altitude. Areas where cloud heights could not be determined are shown in dark gray.
The pair on the left shows Wilma on Tuesday, October 18, when Hurricane watches were posted for Cuba and Mexico. The central pair shows the eye of Hurricane Wilma just hours before the storm began to cross the Yucatan Peninsula on Friday, October 21. At that time, Wilma was a powerful Category 4 Hurricane on the Saffir-Simpson scale, and had a minimum recorded central pressure of 930 millibars. Hurricane Wilma surged from tropical storm to Category 5 hurricane status in record time, but the storm slowed and weakened considerably after battering Mexico’s Yucatan Peninsula and the Caribbean. The right-hand image pair displays the eastern edges of a weakened Wilma, when Wilma had been reduced to Category 2 status and was just starting to reach southern Florida on the morning of Sunday, October 23. Wilma gathered speed and strengthened on Sunday night, crossing Florida as a Category 3 storm on Monday, October 24.
On the 18th, Wilma looked a bit ragged. Its eye is located at the center of the left edge, and its outer bands of clouds appear to be dominated by a rather loose collection of thunderstorms. In the photo-like images, these look like areas of “boiling clouds,” and in the cloud-height image, these appear as orange blobs, sometimes topped with pinkish-red. On October 21 (center), when Wilma was a Category 4 storm, cloud-top height on the eastern side of the storm near the eye reached 18 kilometers in altitude, with lower heights on the western side. The image from the 23rd shows the eastern edge of Wilma as it approached Florida (upper right) and Cuba (center right).
MISR has nine different cameras that view the Earth from a variety of angles. Shifts in the clouds’ apparent position from one camera’s perspective to another’s allows MISR to measure the height of the cloud-tops. MISR scientists have programmed computers to compare the different views, identify features that appear to shift from view to view, and use that information to calculate cloud height automatically. The height fields pictured have not been corrected for the effects of cloud motion. Wind-corrected heights (which have higher accuracy but sparser spatial coverage) are within about 1 kilometer of the heights shown here.
The Multi-angle Imaging SpectroRadiometer observes the daylit Earth continuously, viewing the entire globe between 82° North and 82° South latitude every nine days. Each image covers an area of about 380 kilometers by 1,830 kilometers. The data products were generated from a portion of the imagery acquired during Terra orbits 31037, 31081 and 31110, and utilize data from within blocks 68-83 within World Reference System-2 paths 13, 16 and 18, respectively.
Image courtesy NASA/GSFC/LaRC/JPL, MISR Team. Text by Clare Averill (Raytheon RIS/JPL) and Greg McFarquhar (University of Illinois).