A new study of the Patagonia Icefields in South America by NASA and Chile’s Centro de Estudios Cientificos concludes the icefields—the largest non-Antarctic ice masses in the Southern Hemisphere—are thinning at an accelerating pace, faster than other areas on the planet. The runoff from these melting icefields is contributing to an ongoing rise in global sea level. (Click to read the NASA press release.)
Conventional topographic data from the 1970s and 1990s were compared with data from NASA’s February 2000 Shuttle Radar Topography Mission to measure changes in the volumes of the 63 largest glaciers in the region over time. The researchers concluded the thinning rate of the Patagonia Icefields more than doubled during the period from 1995 through 2000 versus the period from 1975 to 2000. In other words, the rate of thinning went from 0.04 millimeters (0.0016 inches) per year to 0.1 millimeters (0.004 inches) per year. The 1975 � 2000 rate of loss in ice mass equals about 9 percent of the total annual global sea level rise from mountain glaciers of 0.45 millimeters (0.02 inches) per year. (Note: the total global sea level rise from all known sources is about 1.8 millimeters, or 0.07 inches, per year.) The researchers attribute the increased thinning to climate change and the unique dynamic response of the region’s glaciers to climate change.
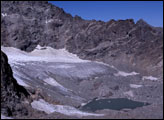
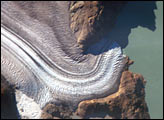
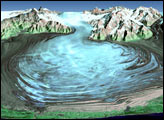
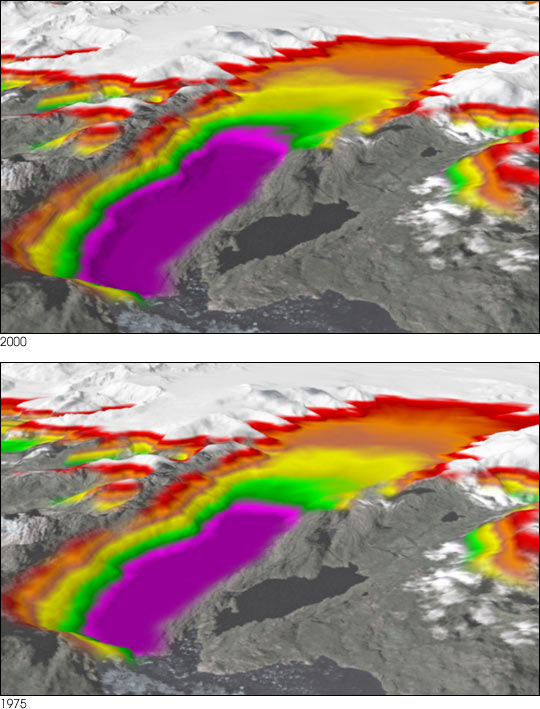
The images above, and this animation, depict the thinning of Jorge Montt Glacier, in the northern part of the Southern Patagonia Icefield, South America. The color bands in the images represent contour intervals. Each complete color band (ranging from dark to light) represents 100 meters of elevation, starting with purple, which represents sea level. The Jorge Montt Glacier drains an area of 510 square kilometers (197 square miles) into Baja Jorge Montt in the Pacific Ocean. The glacier’s ice is thinning most at low elevations, where air temperature is the highest. Ice thinning between 1975 and 2000 averaged 3.3 meters (10.8 feet) per year over the entire glacier, and reached 18 meters (59.1 feet) per year at the lowest elevations. The glacier calving front experienced a major retreat of 8.5 kilometers (5.28 miles) in those 25 years as a result of rapid thinning.
The animation begins with an image of the glacier configuration in 2000 using an overlay of Landsat Thematic Mapper data and Shuttle Radar Topography Mission (SRTM) topography. The overlay then dissolves into a color map of the present-day topography, then morphs back into the 1975 topography before returning to the 2000 topography and overlay. As the scene morphs between the SRTM and 1975 topography, the contours move down the valley, indicating that the ice was thicker in 1975.
Images and animation by Vince Realmuto, based on research by Eric Rignot, NASA Jet Propulsion Lab