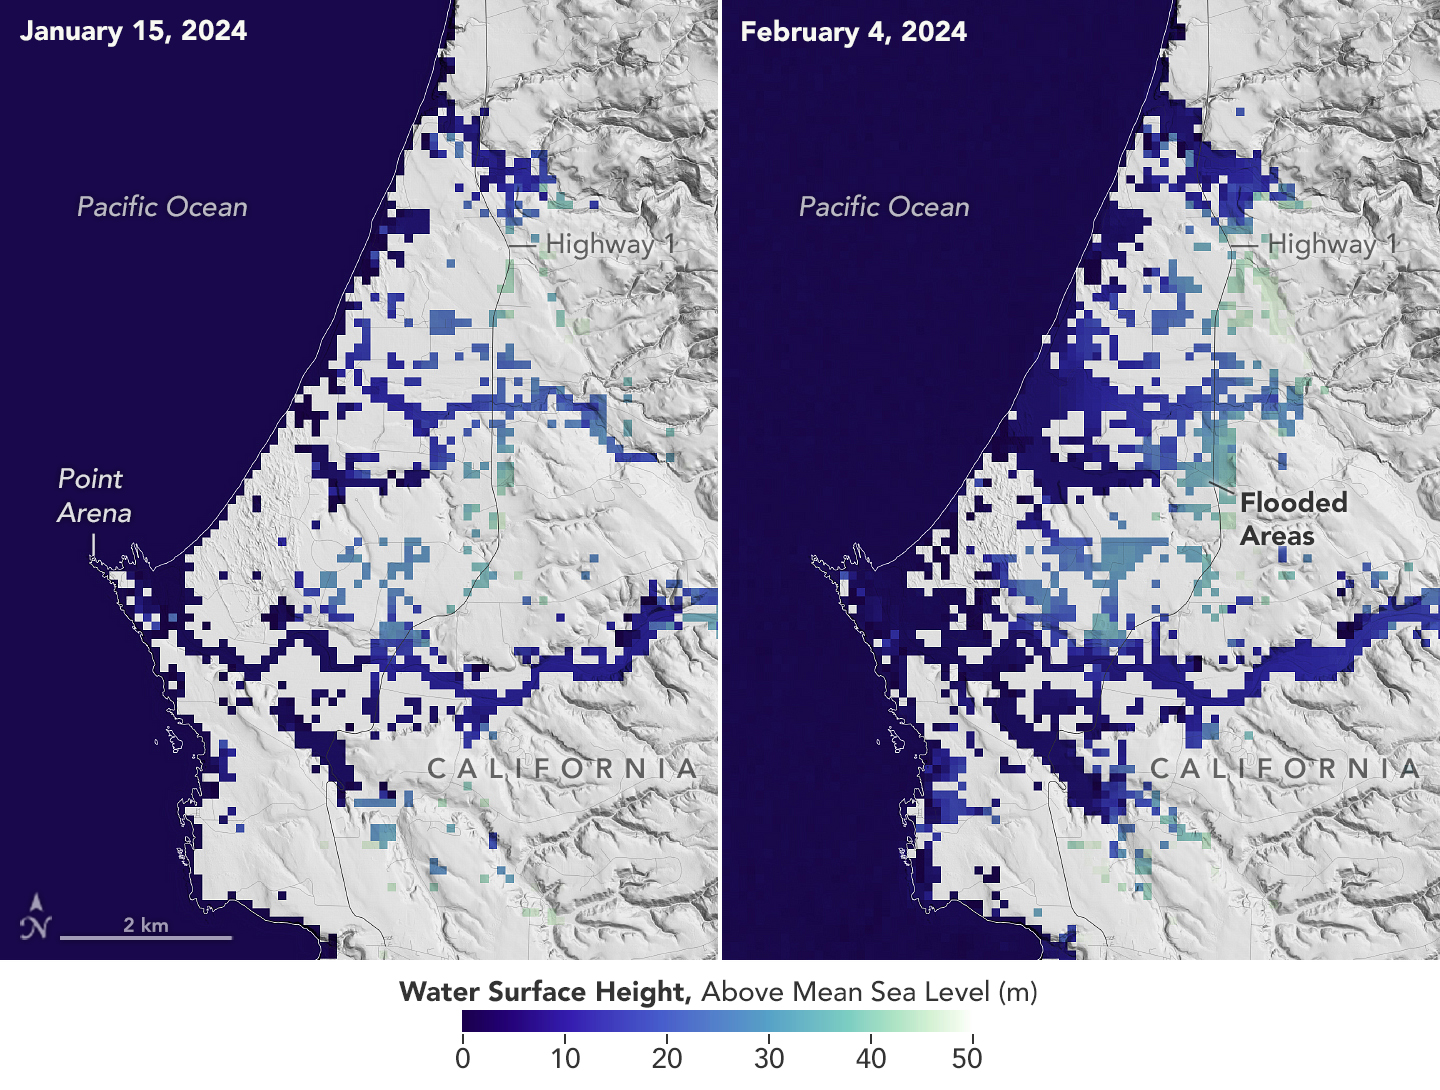
A series of atmospheric rivers drenched California in February, with record amounts of rainfall and hurricane-force winds sweeping across parts of the state. At one point, weather agencies posted flood watches for nearly the entirety of California’s coast. The SWOT (Surface Water and Ocean Topography) mission captured data on some of the flooding near the community of Manchester, roughly 105 miles (169 kilometers) north of San Francisco. The satellite is a collaboration between NASA and the French space agency, CNES (Centre National d‘Études Spatiales).
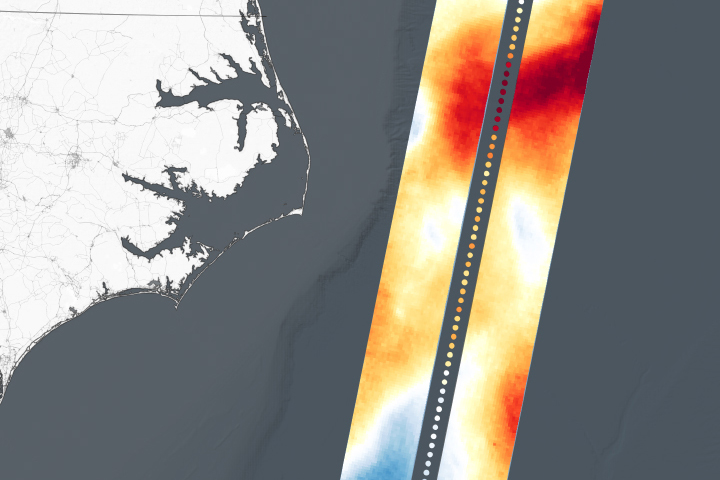
This image shows the area on January 15, 2024, before the rain and snow from atmospheric rivers, and then again on February 4, after the first in a series of storms soaked California. Water heights are shown in shades of green and blue, with lighter hues indicating the highest levels relative to mean sea level. (Data for inland areas includes the height of the floodwaters plus the ground elevation beneath it.) Some coastal areas were flooded by both ocean tides and heavy rain, while others were likely flooded only by precipitation. Each pixel in the image represents an area that is 330 feet by 330 feet (100 meters by 100 meters).
Since December 2022, SWOT has been measuring the height of nearly all water on Earth’s surface, developing one of the most detailed, comprehensive views yet of the planet’s ocean and freshwater lakes and rivers. Not only can the satellite detect the extent of the water on Earth’s surface, as other satellites can, but SWOT can also provide water level data. Combined with other types of information, SWOT measurements can yield water depth data in features like lakes and rivers.
“SWOT gives us information about flooding that we’ve never had before,” said Ben Hamlington, lead researcher for NASA’s sea level change team at the agency’s Jet Propulsion Laboratory in Southern California. Satellites can provide pictures showing how much of an area is flooded, but unless instruments are already installed on a river or at the coast, it’s difficult to know how conditions evolve during and after a flood. “Data from the SWOT satellite, combined with other information, is filling in this picture,” said Hamlington.
The SWOT science team made the measurements using the KaRIn (Ka-band Radar Interferometer) instrument. With two antennas spread 33 feet (10 meters) apart on a boom, KaRIn produces a pair of data swaths as it circles the globe, bouncing radar pulses off water surfaces to collect surface-height measurements.
NASA Earth Observatory image by Lauren Dauphin, using SWOT data provided by the SWOT science team. Story by Jane Lee (NASA Jet Propulsion Laboratory).