The El Marino Language School in Culver City, California, sits just a few hundred feet from Interstate 405, one of the busiest highways in the United States. Hundreds of thousands of cars pass by each day, leaving behind a cloud of nitrogen dioxide (NO2), particulate matter, and other air pollutants. The school—which primarily serves Hispanic, Black and African American, and Asian students—is located in a part of Southern California where satellites often measure elevated concentrations of NO2.
“This isn’t something we see in just one city or one region,” said Michael Cheeseman, an atmospheric scientist at Colorado State University and now the National Oceanic and Atmospheric Administration. “When you look at NASA satellite data across the United States and compare that to socioeconomic data about our schools, the picture is clear: Hispanic, Asian, and Black and African American public school children attend schools with higher concentrations of air pollution than white students, especially in urban areas.”
Cheeseman and colleagues considered ambient air pollution concentrations for 98,537 public schools in the United States as part of an analysis published in GeoHealth. The research revealed what Cheeseman described as “surprisingly large” differences in air pollution concentrations for different racial and ethnic groups.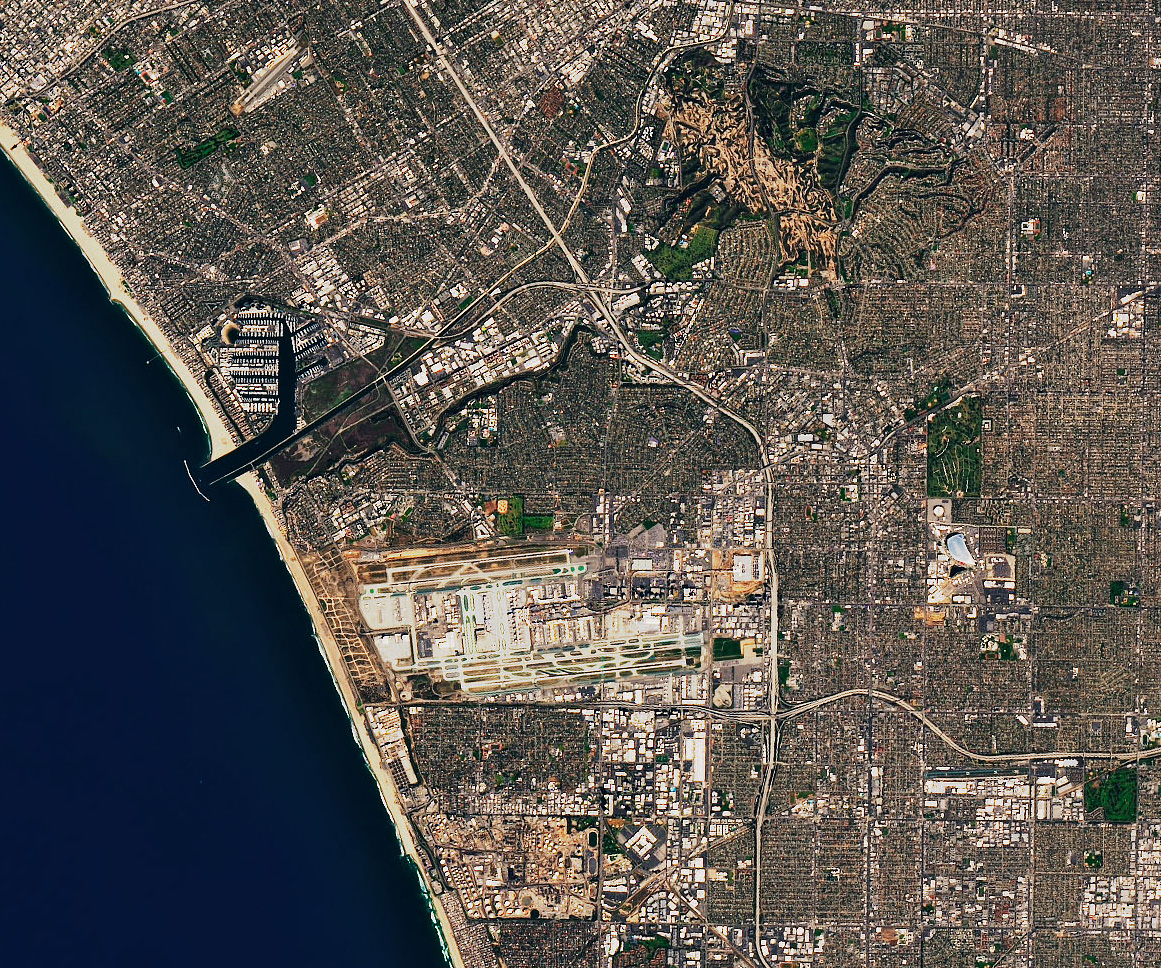
Air pollution comes with costs to health and academic performance. “We know that long-term exposure has been linked to increased risks of asthma, increased respiratory infections, and reduced lung function among children,” said Shobhana Gupta, a trained physician who is now the associate manager of NASA’s Earth Action Equity & Environmental Justice program. “Children have higher respiratory rates and their lungs are still developing, so they are more susceptible to air pollutants.” Some research also links air pollution exposure to impaired cognitive function, depression, lower test scores, and low school attendance rates.
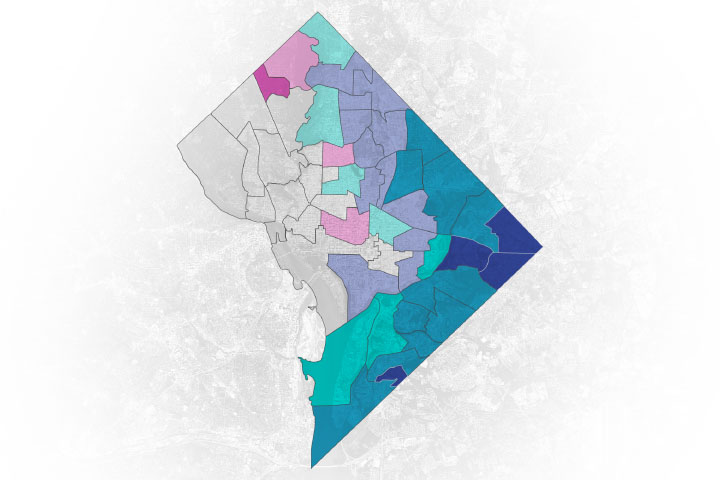
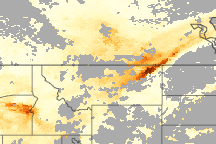
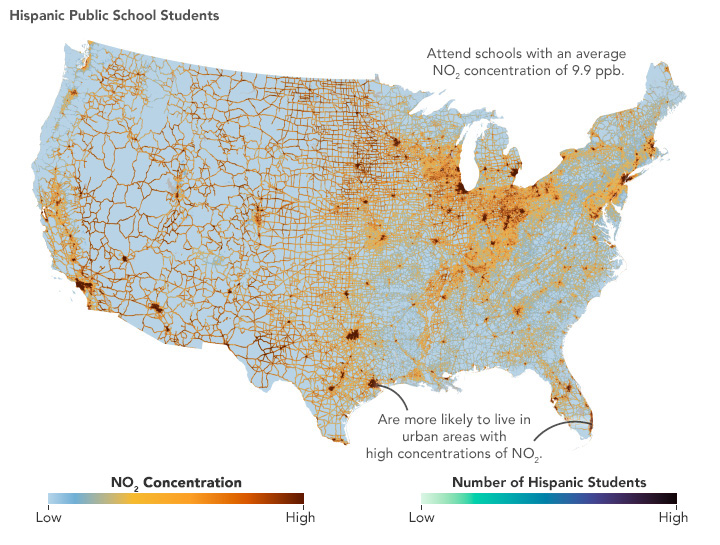
The hotspot around Culver City and many other areas of high NO2 concentrations (red) are visible in the series of maps in this story. They show an average of three years (2017-2019) of NO2 concentration data derived from information about the location of roads, power plants, and other NO2 sources, as well as observations collected by the OMI (Ozone Monitoring Instrument) sensor on NASA’s Aura satellite. NO2 is a highly reactive gas formed by combustion that puts stress on the human respiratory system. The gas comes mainly from fossil fuel combustion for transportation and industrial activity.
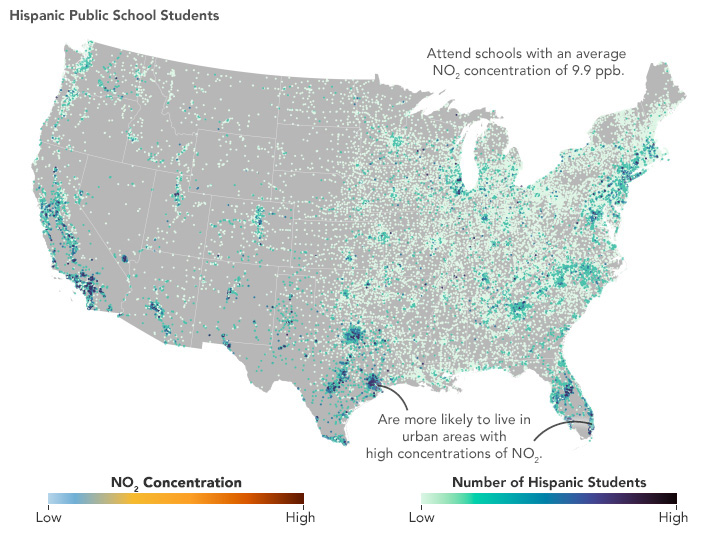
“Averaged nationally, we saw roughly a two parts per billion (ppb) difference in NO2 between Hispanic and white students—9.9 ppb for Hispanic students compared to 7.7 parts per billion for white students,” Cheeseman said. On average, annual concentrations were 9.7 ppb for Asian students and 9.2 ppb for Black and African American students. “But in certain cities and regions, that difference was stark. If you look at parts of New York City or Los Angeles, you start to see disparities that are nine or 10 times larger than that.” The national standard—the maximum amount allowed by the Clean Air Act—for NO2 is 53 ppb averaged over one year.
Much of the difference relates to where different racial and ethnic groups tend to live. Hispanic, Asian, and Black and African American students are often located in dense urban areas that are frequently exposed to large amounts of vehicle traffic, factories, and other sources of nitrogen dioxide. White students tend to live in rural or suburban areas with less air pollution.
This urban-rural divide is particularly pronounced in the Midwest and Northeast. “We also saw clear disparities within individual cities,” Cheeseman said. “In some cities, like Jacksonville, San Francisco, and New York City, students of color are clustered in neighborhoods with higher levels of pollution than their white peers living within the same city.”
Though historically marginalized groups—especially communities with high rates of poverty—experienced the highest concentrations of NO2 overall, there were exceptions. Many Indigenous students attend school in rural areas with few pollution sources and low concentrations of NO2. Likewise, significant numbers of Black and African American students attend school in rural communities in the Southeast with low concentrations of air pollution.
It was in the NO2 data, rather than data on particulate matter, where researchers found the strongest relationship between race or ethnicity and measurements of air pollution, according to Cheeseman's study, one of several conducted by a group of researchers using satellite data to study environmental inequity through NASA’s Health and Air Quality Applied Sciences Team (HAQAST).
“We see a stronger relationship with NO2 because it is so short-lived and tends to be highest close to emission sources,” said Susan Anenberg, director of the George Washington University Climate and Health Institute. “Since particulate matter lasts longer in the atmosphere, has more emissions sources, sometimes forms in the atmosphere downwind of emissions sources, and gets blown around by weather systems, you end up with less spatial variation compared with NO2.”
For Cheeseman, identifying the problem in satellite data is just one part of the research. “We’re talking about thousands of schools spread across this country with this same problem,” he said. “We need solutions equal to the scale of the problem.” For example, he said, zoning rules that prevent schools from being built near major sources of air pollution like highways, airports, ports, and factories are a logical next step that could reduce disparities.
There are also ways to bolster the safety of students in schools with high exposure pollution levels. Members of the El Marino Language School community successfully advocated for the installation of a new air filtration system and other upgrades to improve indoor air quality for students, according to reporting from California State University Northridge.
“A few years ago, we had very little experience using satellite data to identify racial and ethnic disparities in air pollution,” Anenberg said. “Now we’re doing everything we can to get that knowledge out beyond the research community and use it to inform actions that can address the problem.” For instance, the HAQAST team is currently working with developers of platforms widely used by the environmental justice community, such as the Environmental Protection Agency’s EJScreen tool, to potentially include satellite observations.
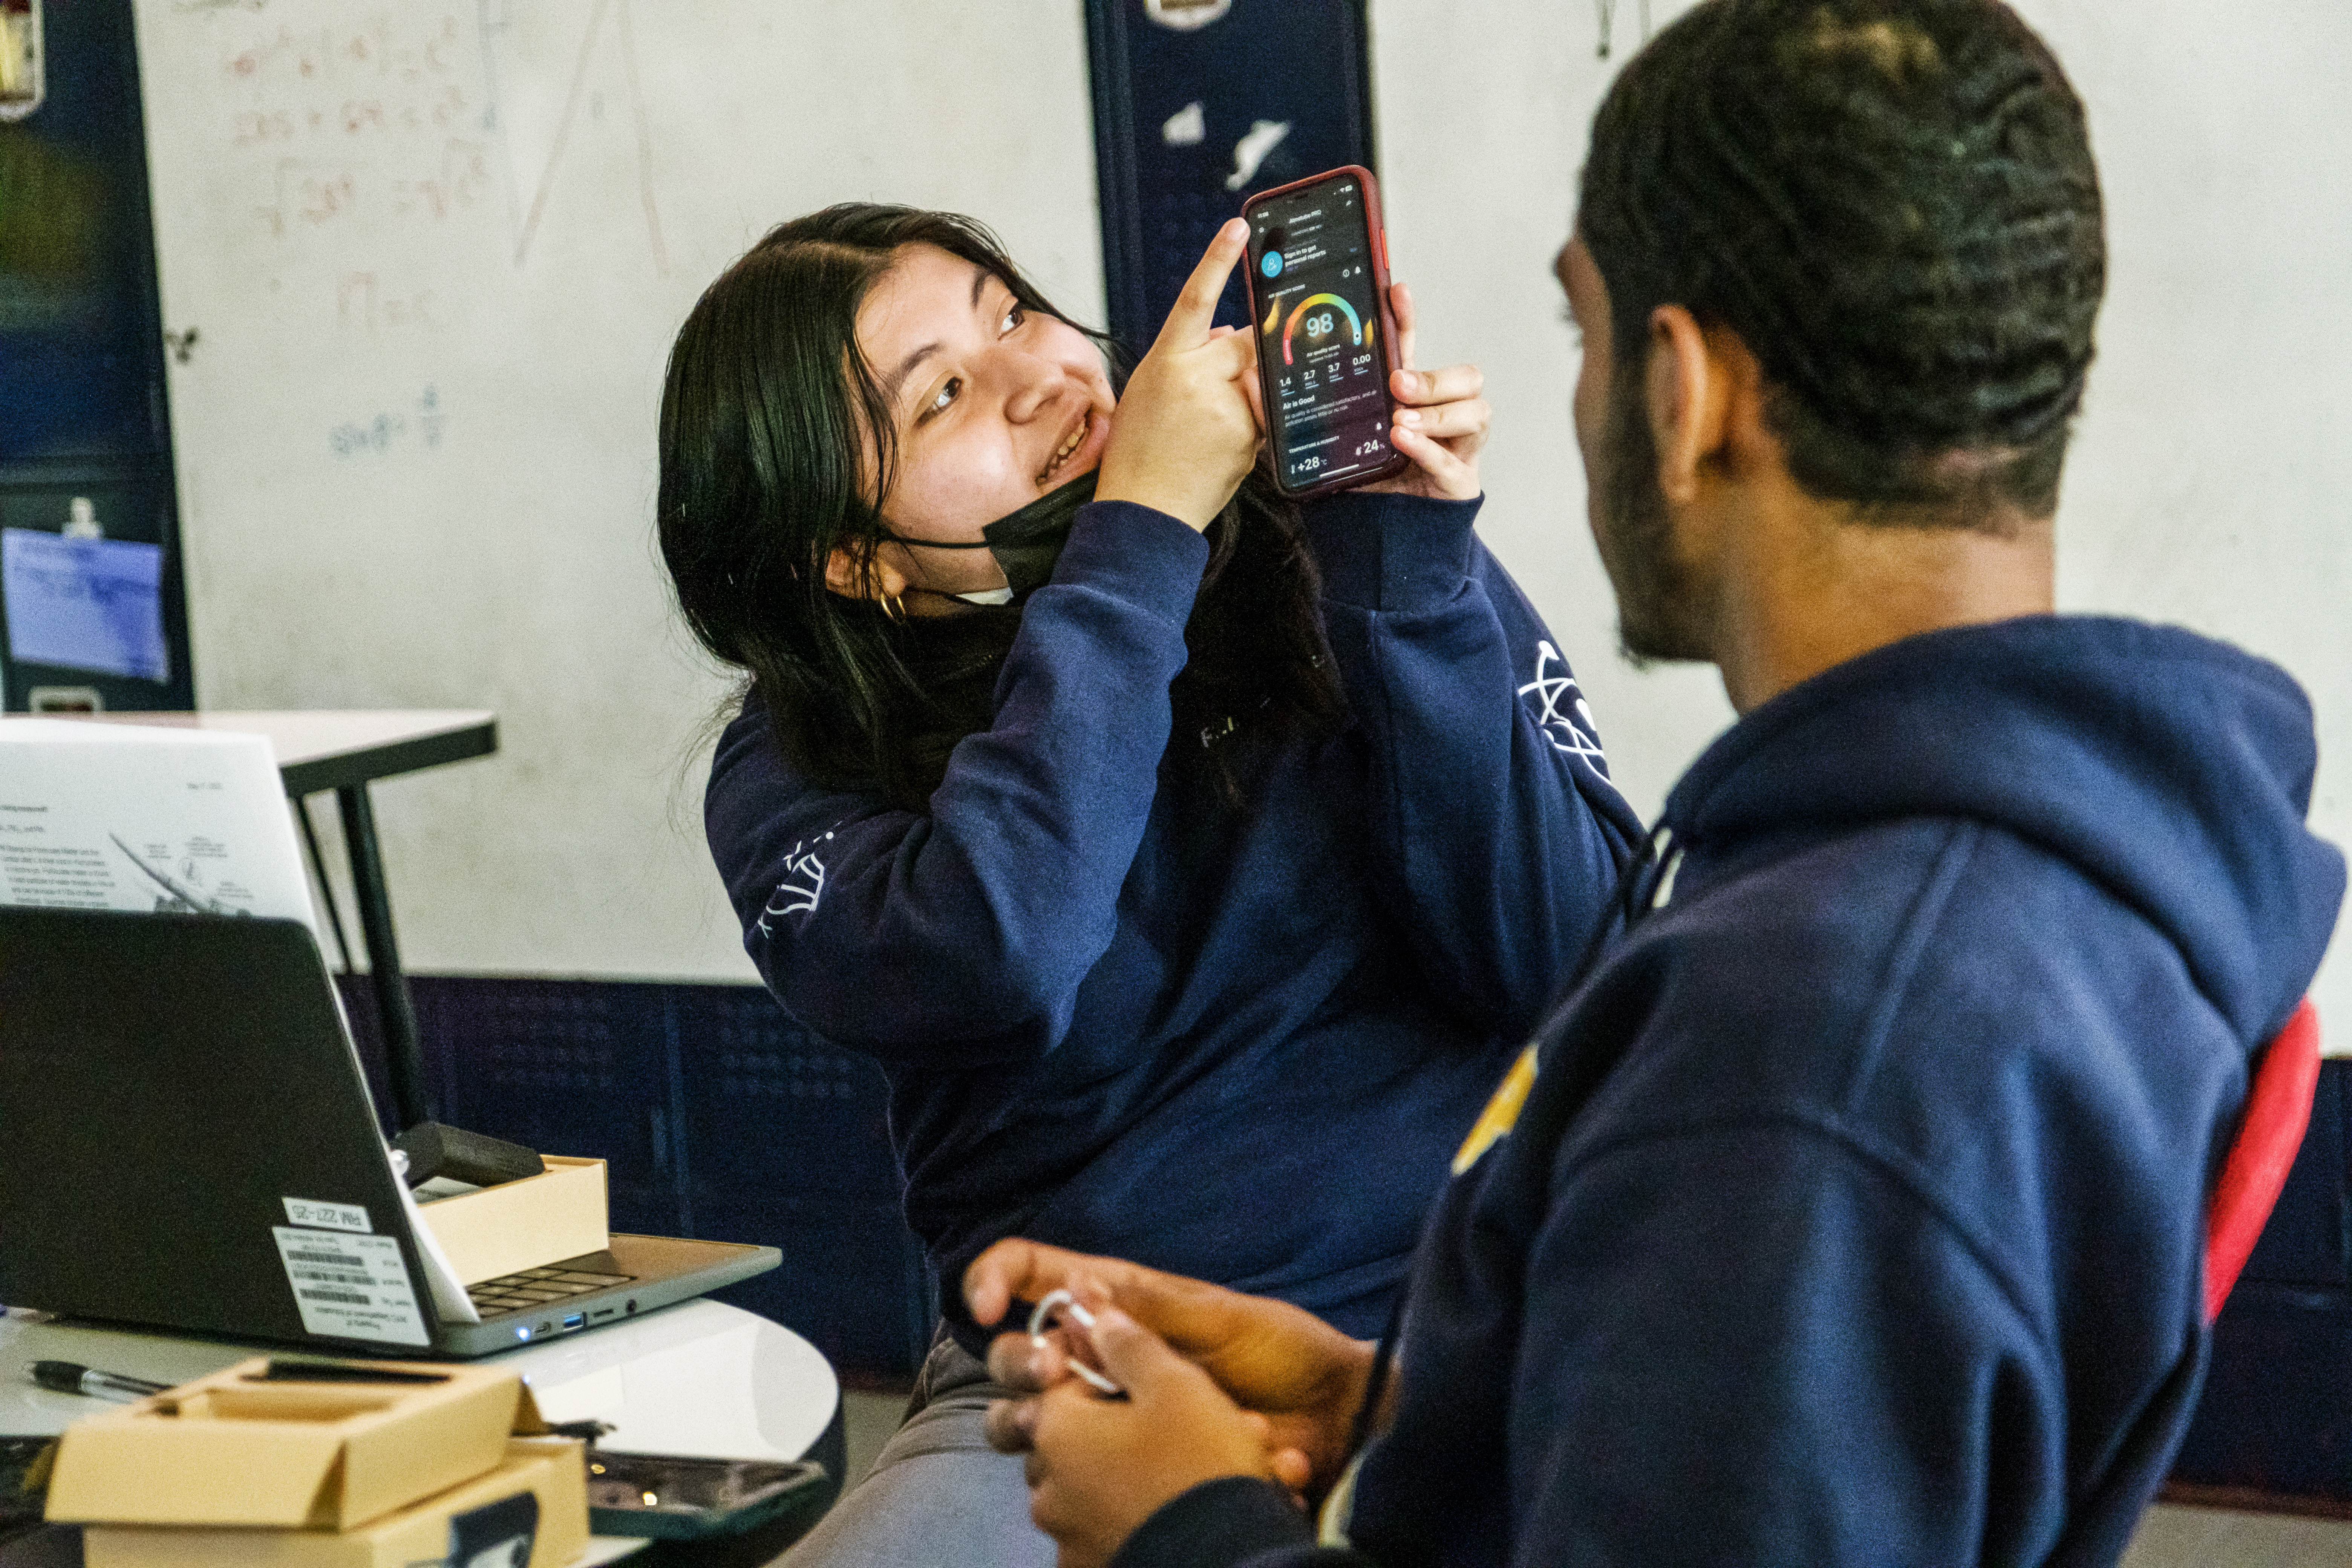
In the past few years, NASA has scaled up a broader equity and environmental justice research program. Among the dozens of currently funded projects is a citizen-science effort conducted by students from the Bronx Center for Science and Mathematics High School in New York City that are monitoring the challenge of air pollution directly. The school, located in the heart of the Bronx, is hemmed in between several highways in an area known for having high asthma rates. As part of the project, co-led by Columbia University researchers Carolynne Hultquist and Susana Beatriz Adamo, students are using portable air quality sensors to monitor air indoor and outdoor air pollution at ground level. They will also compare their measurements to satellite observations of outdoor pollution. The photo above, taken by Keerti Gopal, shows a senior at the school showing how she set up an air quality monitoring app on her phone.
“We want our scientists to be working in partnership with the community,” Gupta said. “This project in the Bronx is a great example of that approach.”
More information about how to access and use NASA satellite data for equity research is available from the websites of the NASA Applied Remote Sensing Training (ARSET), NASA Earthdata, and NASA’s Applied Science Program.
NASA Earth Observatory animations by Wanmei Liang, using data from Cheeseman, Michael, et al. (2022). Student demographic data from the National Center for Education Statistics. NASA Earth Observatory image by Joshua Stevens, using Landsat data from the U.S. Geological Survey. Photograph courtesy of Keerti Gopal. Story by Adam Voiland.