Thirty years ago, scientists and engineers launched a new satellite to study the rising and falling of seas over time, a task that once could only be done from the coast. TOPEX/Poseidon rocketed into space on August 10, 1992, and started a 30-year record of ocean surface height around the world. The observations have confirmed on a global scale what scientists previously saw from the shoreline: the seas are rising, and the pace is quickening.
Scientists have found that global mean sea level—shown in the line plot above and below—has risen 10.1 centimeters (3.98 inches) since 1992. Over the past 140 years, satellites and tide gauges together show that global sea level has risen 21 to 24 centimeters (8 to 9 inches).
Starting with TOPEX/Poseidon, NASA and partner space agencies have flown a continuous series of satellites that use radar altimeters to monitor ocean surface topography—essentially, the vertical shape and height of the ocean. Radar altimeters continually send out pulses of radio waves (microwaves) that reflect off the ocean surface back toward the satellite. The instruments calculate the time it takes for the signal to return, while also tracking the precise location of the satellite in space. From this, scientists derive the height of the sea surface directly underneath the satellite.
Since 1992, five missions with similar altimeters have repeated the same orbit every 10 days: TOPEX/Poseidon (1992 to 2006), Jason-1 (2001 to 2013), the Ocean Surface Topography Mission/Jason-2 (2008 to 2019), Jason-3 (2016 to present), and Sentinel-6 Michael Freilich (2020 to present). The missions were built through various partnerships between NASA, France’s Centre National d'Etudes Spatiales (CNES), the European Organisation for the Exploitation of Meteorological Satellites (EUMETSAT), the European Space Agency (ESA), and the U.S. National Oceanic and Atmospheric Administration (NOAA).
Together, the mission teams have assembled a unified, standardized ocean topography record that is equivalent to the work of a half-million tide gauges. The scientists accumulated and corroborated a data record that is now long enough and sensitive enough to detect global and regional sea level changes beyond the seasonal, yearly, and decadal cycles that naturally occur.
“With 30 years of data, we can finally see what a huge impact we have on the Earth’s climate,” said Josh Willis, an oceanographer at the Jet Propulsion Laboratory and NASA’s project scientist for Sentinel-6 Michael Freilich. “The rise of sea level caused by human interference with the climate now dwarfs the natural cycles. And it is happening faster and faster every decade.”
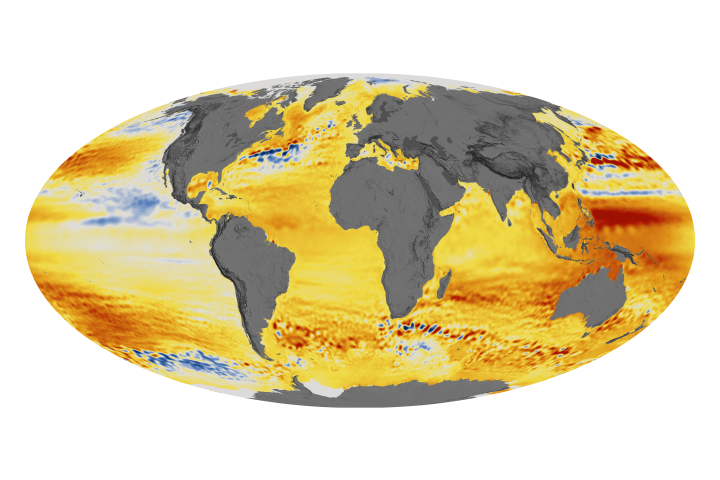
The map at the top of this page shows global trends in sea level as observed from 1993 to 2022 by TOPEX/Poseidon, the three Jason missions, and Sentinel-6 Michael Freilich. Note the spatial variations in the rate of sea level rise, with some parts of the ocean rising faster (depicted in red and deep orange) than the global rate. Many of the anomalies reflect long-term shifts in ocean currents and heat distribution.
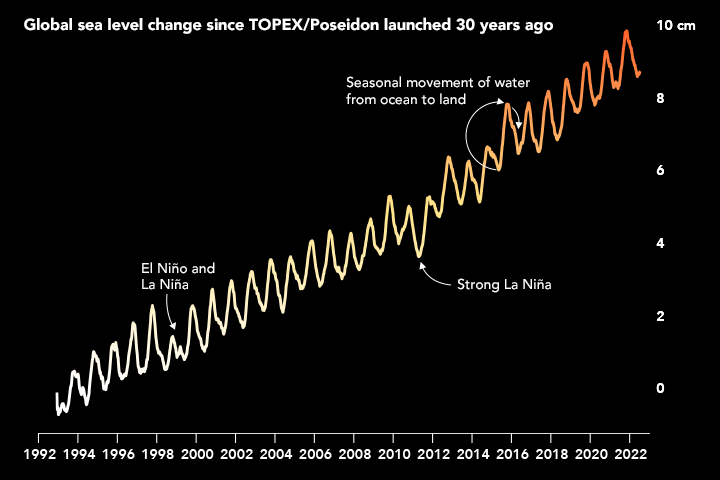
The altimetry data also show that the rate of sea level rise is accelerating. Over the course of the 20th century, global mean sea level rose at about 1.5 millimeters per year. By the early 1990s, it was about 2.5 mm per year. Over the past decade, the rate has increased to 3.9 mm (0.15 inches) per year.
In the line plot, the highs and lows each year are caused by the exchange of water between the land and sea. “Winter rain and snowfall in the northern hemisphere shifts water from ocean to land, and it takes some time for this to runoff back into the oceans,” Willis noted. “This effect usually causes about 1 centimeter of rise and fall each year, with a bit more or less during El Niño and La Niña years. It’s literally like the heartbeat of the planet.”
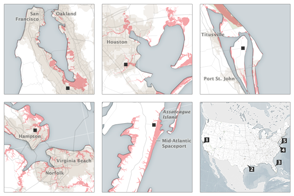
While a few millimeters of sea level rise per year may seem small, scientists estimate that every 2.5 centimeters (1 inch) of sea level rise translates into 2.5 meters (8.5 feet) of beachfront lost along the average coast. It also means that high tides and storm surges can rise even higher, bringing more coastal flooding, even on sunny days. In a report issued in February 2022, U.S. scientists concluded that by 2050 sea level along U.S. coastlines could rise between 25 to 30 centimeters (10 to 12 inches) above today’s levels.
“What stands out from the satellite altimetry record is that the rise over 30 years is about ten times bigger than the natural exchange of water between ocean and land in a year,” Willis said. “In other words, the human-caused rise in global sea level is now ten times bigger than the natural cycles.”
Editor’s Notes—This article is part of a collection explaining how NASA and other science institutions measure and monitor sea level rise. Also: are you looking for data related to sea level rise? The Sea Level Change Data Pathfinder on NASA’s Earthdata site highlights tools used by researchers to study ocean altimetry, including the Integrated Multi-Mission Ocean Altimeter Data for Climate Research.
NASA Earth Observatory video and image by Joshua Stevens, using TOPEX/Poseidon data courtesy of Josh Willis/JPL-Caltech. Story by Michael Carlowicz.