As another winter ends with the U.S. West still in the grip of the worst megadrought in 1,200 years, scientists and water managers are looking at the state of the snowpack. Mountain snowpack is a natural reservoir: As it melts out over the course of the spring and summer, it provides a steady supply of water for millions of people who rely upon it for agriculture, industry, and municipal and residential use.
To forecast water supplies for the coming year, hydrologists and water managers rely on measurements of snowpack, particularly the snow water equivalent (SWE), a measure of how much liquid water is stored within snow. In the western U.S., snowpacks usually peak around April 1. Assessment of the snowpack on this date has traditionally been used to help predict streamflows, reservoir storage levels, and potential wildfire conditions for the rest of the year.
This year, with drought-related moisture deficits in the soil and atmosphere, researchers are seeing widespread and severe low-snow and low-runoff conditions across the West, said Benjamin Hatchett, a hydroclimatologist at the Desert Research Institute who studies snow droughts. “Usually, some regions will be bad, some will be doing okay, and others will be doing great,” Hatchett noted. “But when everywhere [in the West] is in this low-snow condition, it’s pretty concerning.”
While satellites can show where snow is, they cannot yet directly measure snow depth or snow water equivalents. Measurements of snow have been made manually since the early 1900s. In the late 1970s, automated ground-based monitoring began with the SNOTEL network, which is managed by the Department of Agriculture’s Natural Resources Conservation Service. The network is composed of more than 900 monitoring stations placed in remote, high-elevation watersheds in the western U.S., where automated instruments measure snowpack, precipitation, temperature, and other climate conditions.
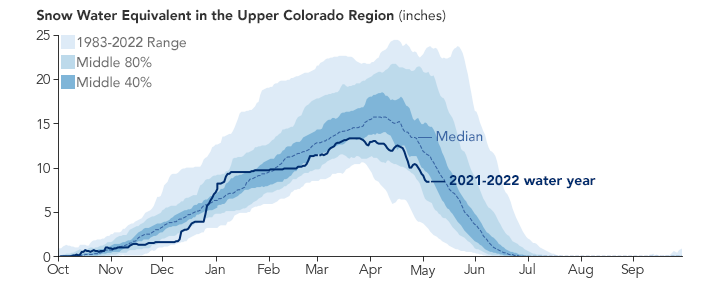
The graph above compares this water-year’s SWE (solid line) to the 1983–2022 median (dashed line) based on SNOTEL data for the Upper Colorado Basin above Lake Powell. The median peak for the entire data record is 15.7 inches—meaning half of the years had peak values above 15.7 inches and half had peaks below it. Peak SWE in this region has typically been reached between April 3–7. This year, the peak SWE of 13.3 inches was reached on March 18 and persisted until March 24, after which it started to decline.
SNOTEL stations record data at a single point location, mostly within a narrow high-elevation range. To estimate the snowpack between and beyond the stations—such as higher elevations and wider geographic areas—researchers must extrapolate and interpolate.
Researchers at the Institute of Arctic and Alpine Research (INSTAAR) at the University of Colorado (CU) Boulder are looking to satellite data to improve those estimates of snow water equivalent. Noah Molotch, an INSTAAR hydrologist with a joint appointment at NASA’s Jet Propulsion Laboratory, and CU-Boulder colleague Leanne Lestak have been using 20 years of satellite data of snow-covered area, along with the SNOTEL data, to generate close to real-time estimates of SWE for use by the U.S. Bureau of Reclamation. Their modeling effort can fill the gaps that ground monitoring doesn’t cover, particularly at certain elevations.
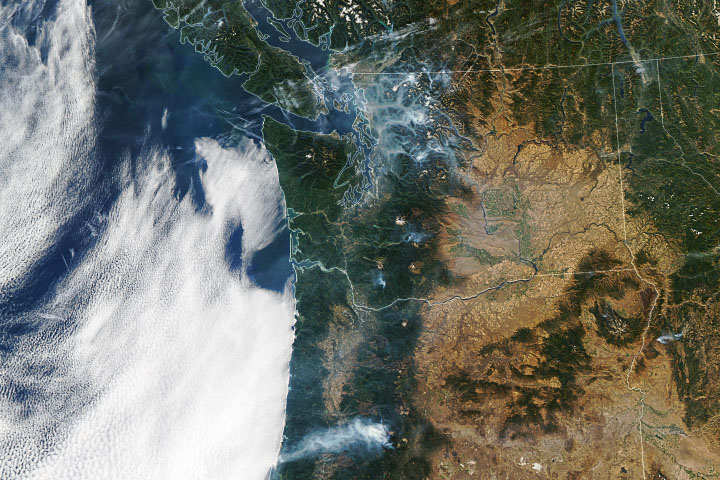
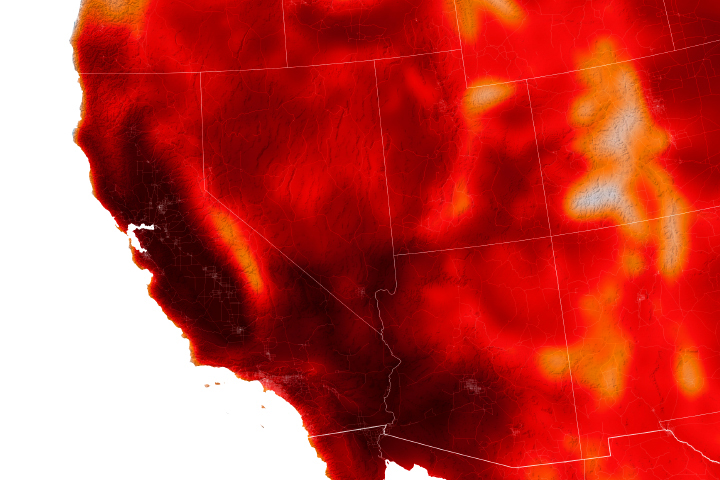
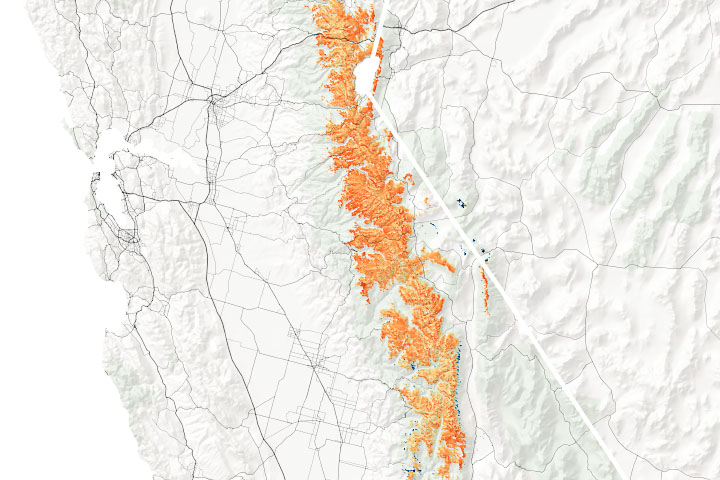
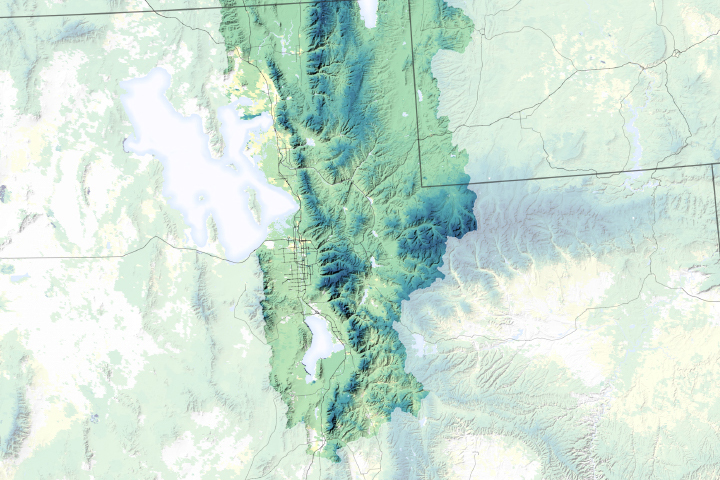
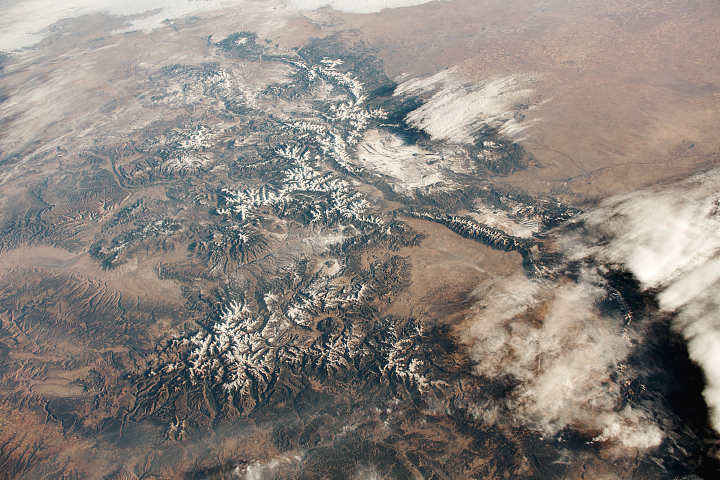
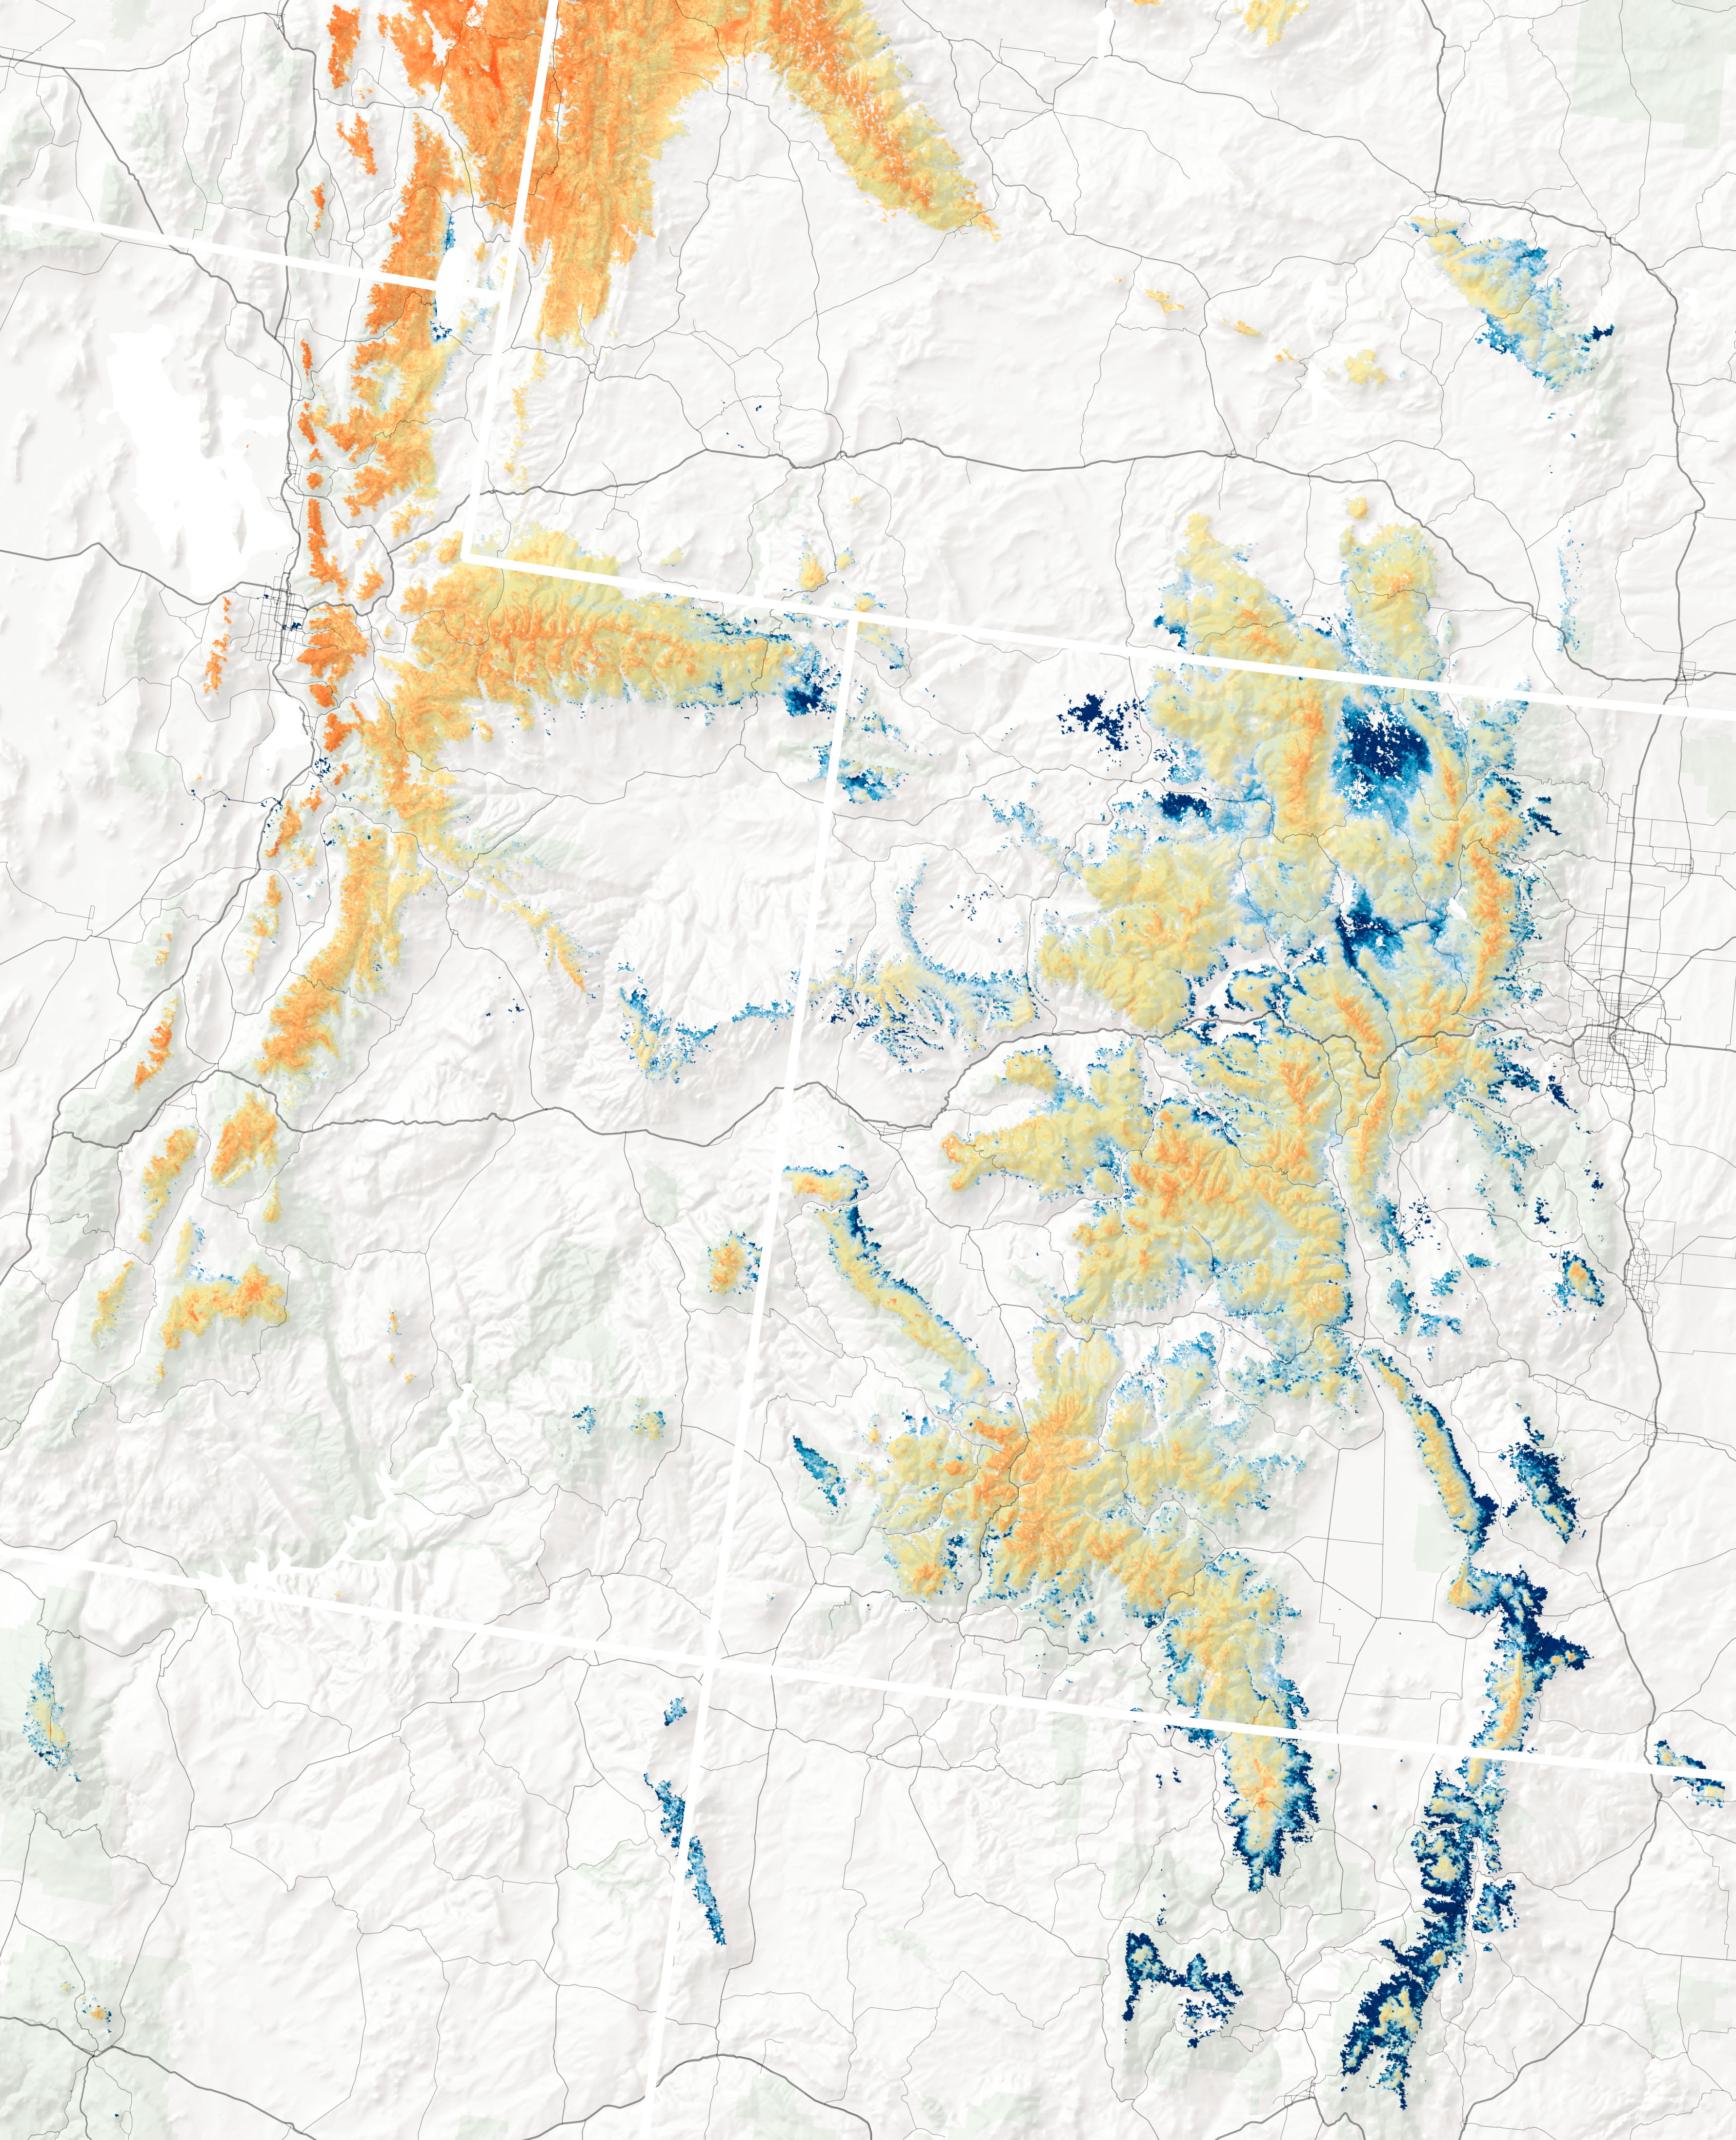
The map at the top of the page shows SWE in the Rocky Mountain region on April 1, 2022, as modeled by the INSTAAR team and compared to the long-term average. The same area is shown below on April 7, 2022, in a natural-color image acquired by the Visible Infrared Imaging Radiometer Suite (VIIRS) on the NOAA-NASA Suomi NPP satellite.
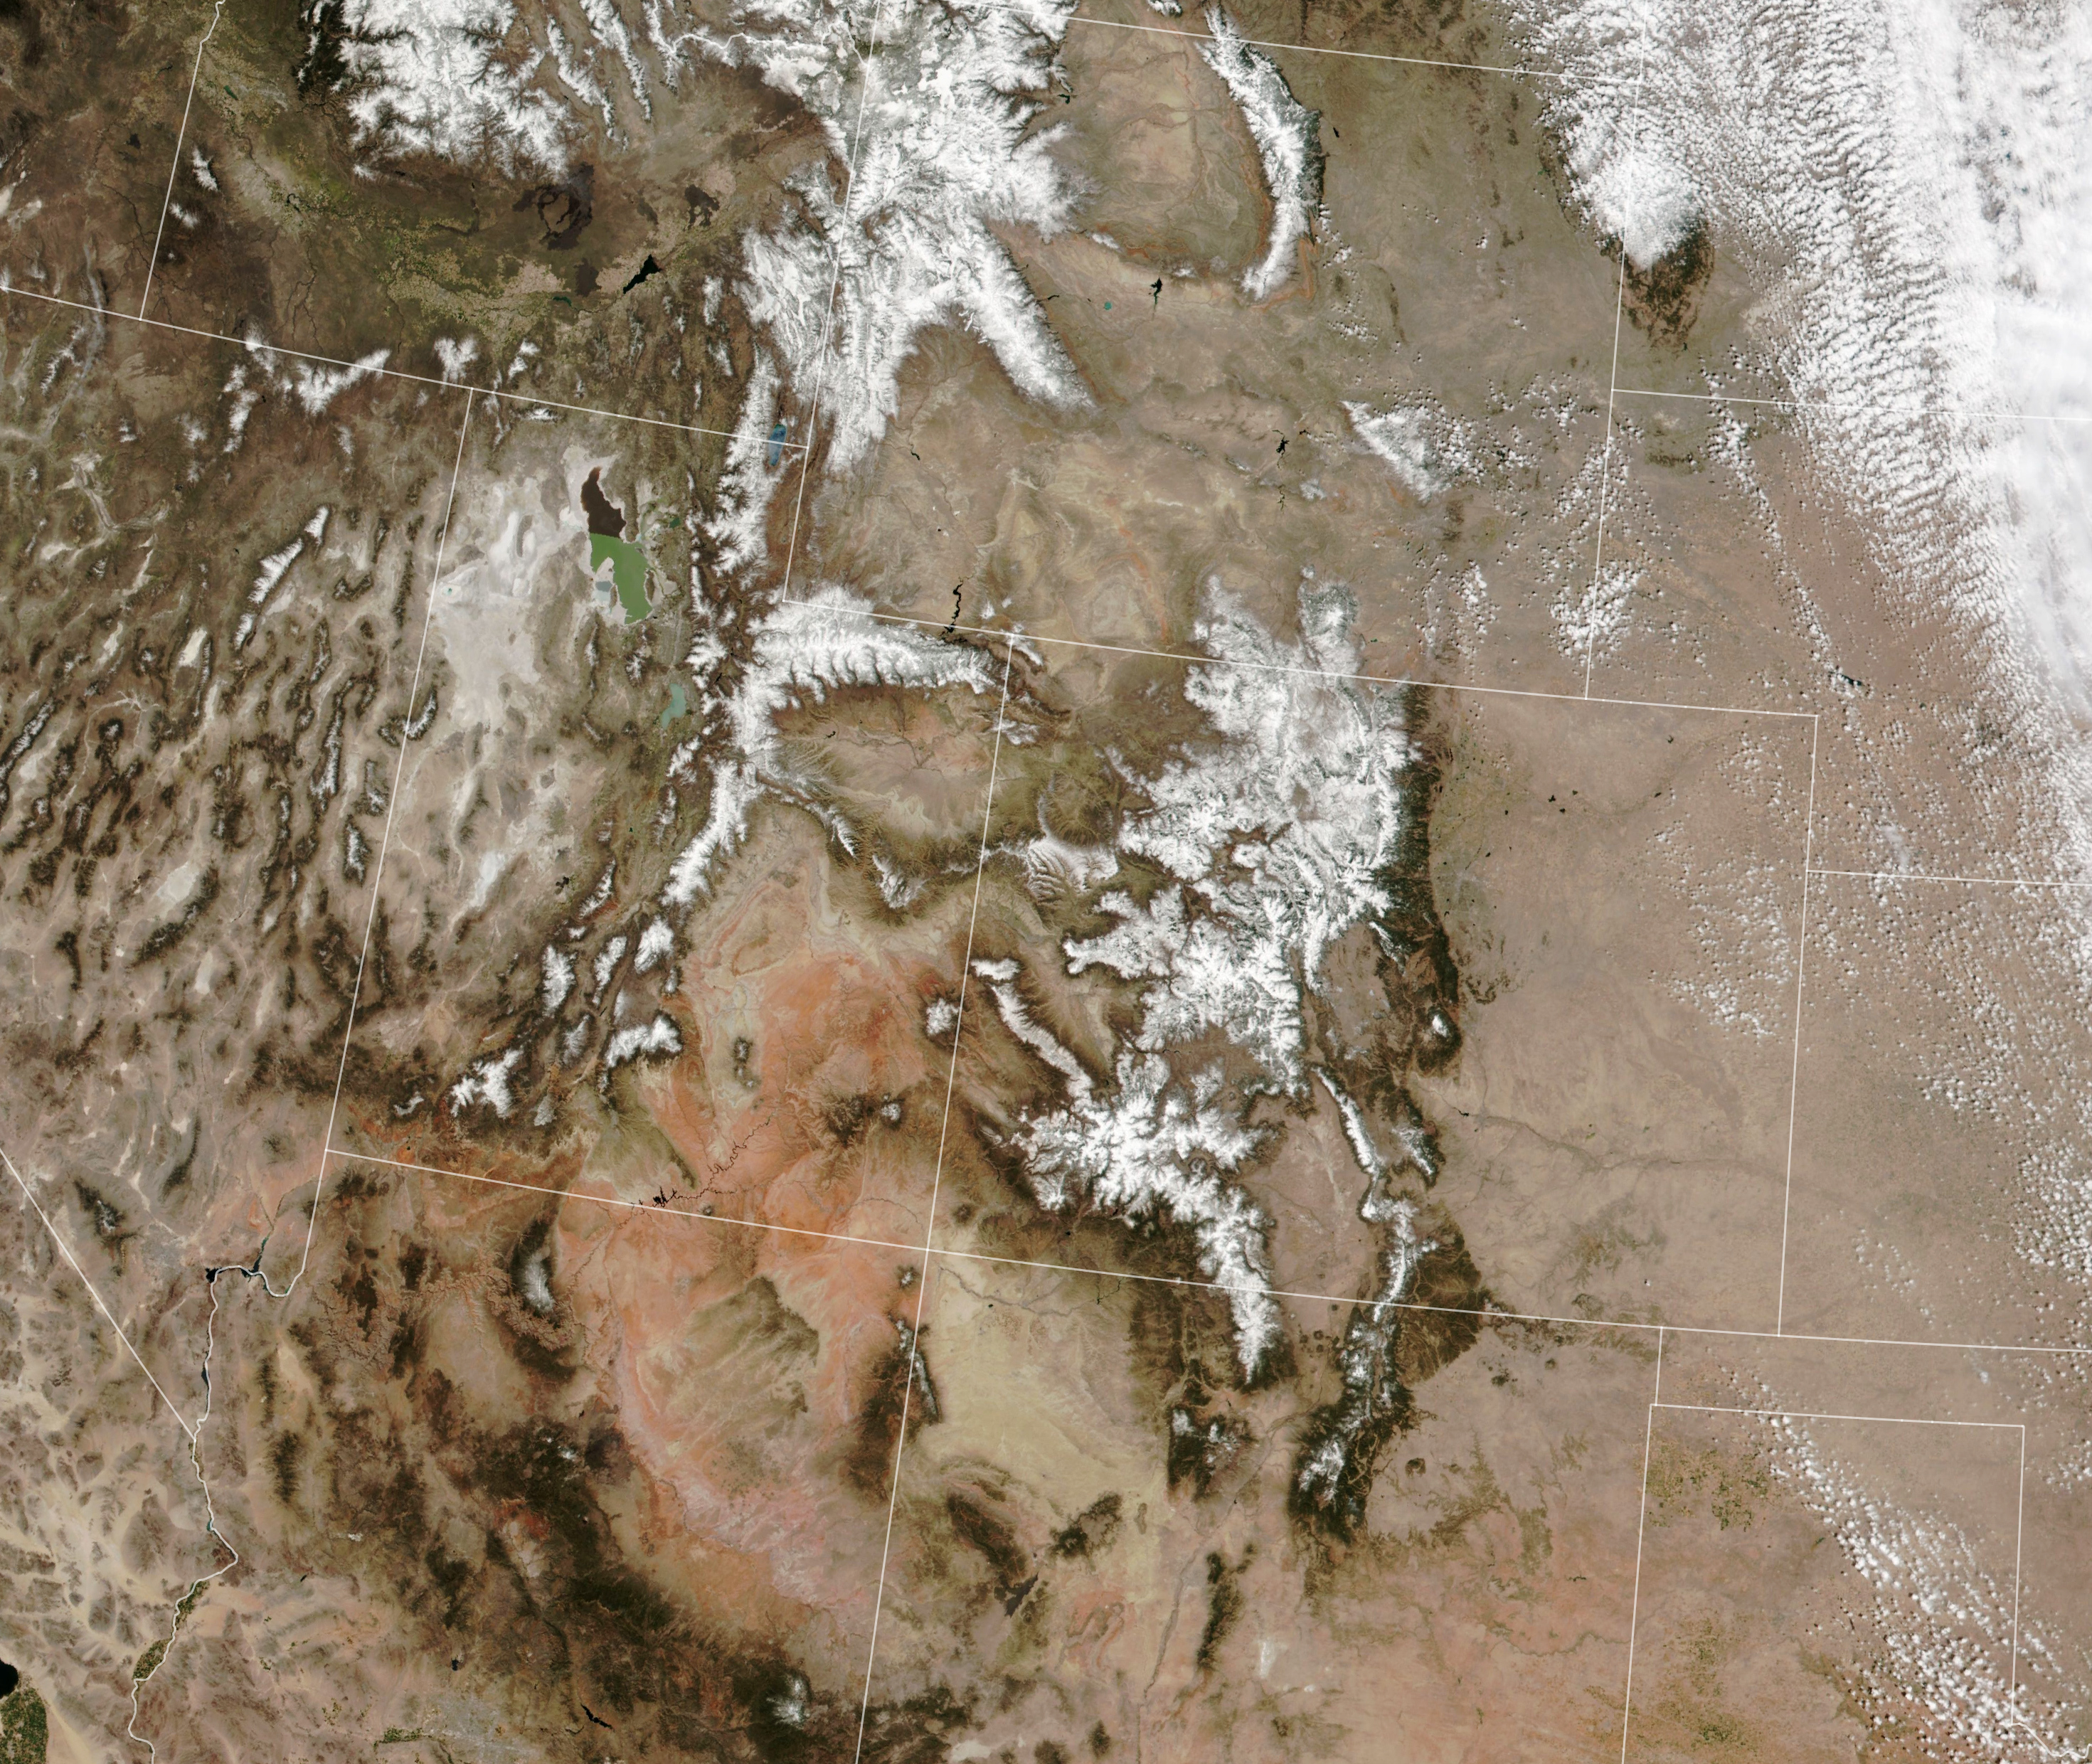
Despite some pockets of anomalously high SWE, most areas range from 46 to 95 percent of the 2000–2020 average. Data on the snow-covered area come from Moderate Resolution Imaging Spectroradiometer (MODIS) on NASA’s Terra satellite. The model also accounts for variables such as elevation, slope, latitude, and upwind mountain barriers, as well as historical patterns of SWE and melting dates.
“Water managers really like to see how much snow there is and what the percentage average is at different elevation bands,” said Molotch. “That’s where actually the spatial product is really valuable. Water managers know that snow from low elevations will run off earlier and increase stream flow early in the season, whereas higher elevations run off later and will be the primary source of streamflow later.”
In an April 18 report issued by the Colorado Basin River Forecast Center, forecasters predicted a near-average to much-below average water supply volume for April to July 2022 across the Upper Colorado River Basin and Great Basin.
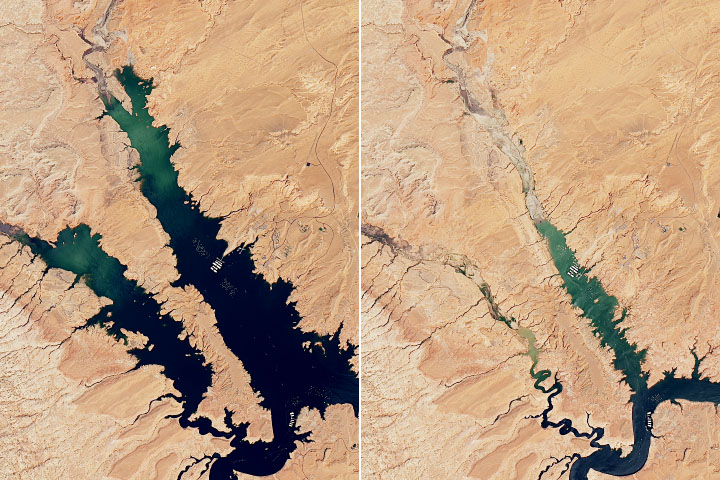
The Colorado River basin covers an area of 246,000 square miles (637,000 square kilometers). This drainage supplies water to tens of millions of people, including those in large urban areas outside the basin, like Denver, Salt Lake City, and Los Angeles, who receive water through diversion projects like tunnels and canals. When snow melts and the water makes it to the Colorado River, it is collected and stored in Lake Mead behind Hoover Dam and in Lake Powell behind Glen Canyon Dam. Hydropower generated at Glen Canyon alone provides electricity to about 5 million people in seven states.
Lake Powell has dropped to its lowest level since the reservoir was first filled in the 1960s. Water behind the dam stands at 3,522 feet above sea level or 24 percent of capacity. If the water drops to a critical level of 3,490 feet, the dam’s ability to produce hydropower will be threatened. On May 3, the U.S. Bureau of Reclamation announced that it will take action to maintain critical hydropower-generating capacity at Lake Powell. Over the next 12 months, the agency will allow more water to flow into the lake from upstream reservoirs and less water to be released downstream.
NASA Earth Observatory images by Joshua Stevens and Lauren Dauphin, using data courtesy of Leanne Lestak/University of Colorado-INSTAAR, the USDA Natural Resources Conservation Service, and VIIRS data from NASA EOSDIS LANCE, GIBS/Worldview, and the Suomi National Polar-orbiting Partnership. Story by Sara E. Pratt.