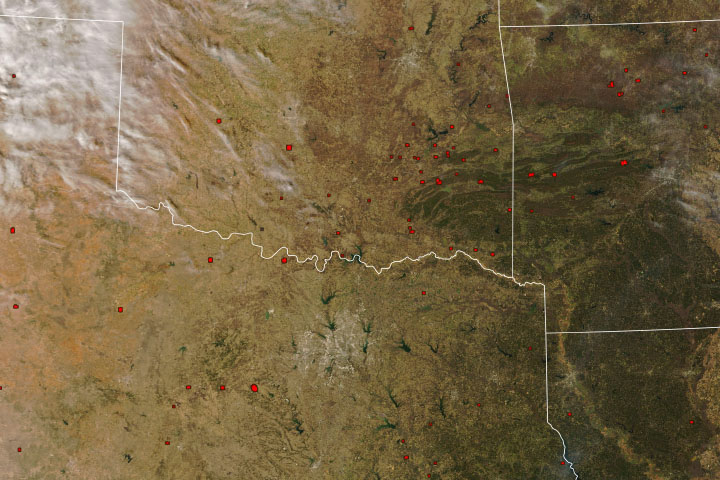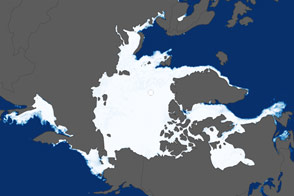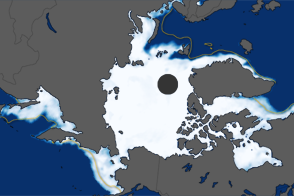
Arctic sea ice appeared to reach its annual maximum extent on February 25, 2022, after growing through the fall and winter. This year’s wintertime extent is the tenth lowest in the satellite record maintained by the National Snow and Ice Data Center. It also tied 2015 as the third earliest maximum on record.
Arctic sea ice extent peaked at 14.88 million square kilometers (5.75 million square miles), a total area that is roughly 770,000 square kilometers (297,300 square miles) below the 1981–2010 average maximum. Compared to the average maximum, the Arctic Ocean in 2022 is missing an area of ice equivalent to the states of Texas and Maine combined.
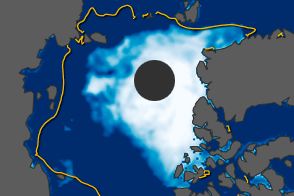
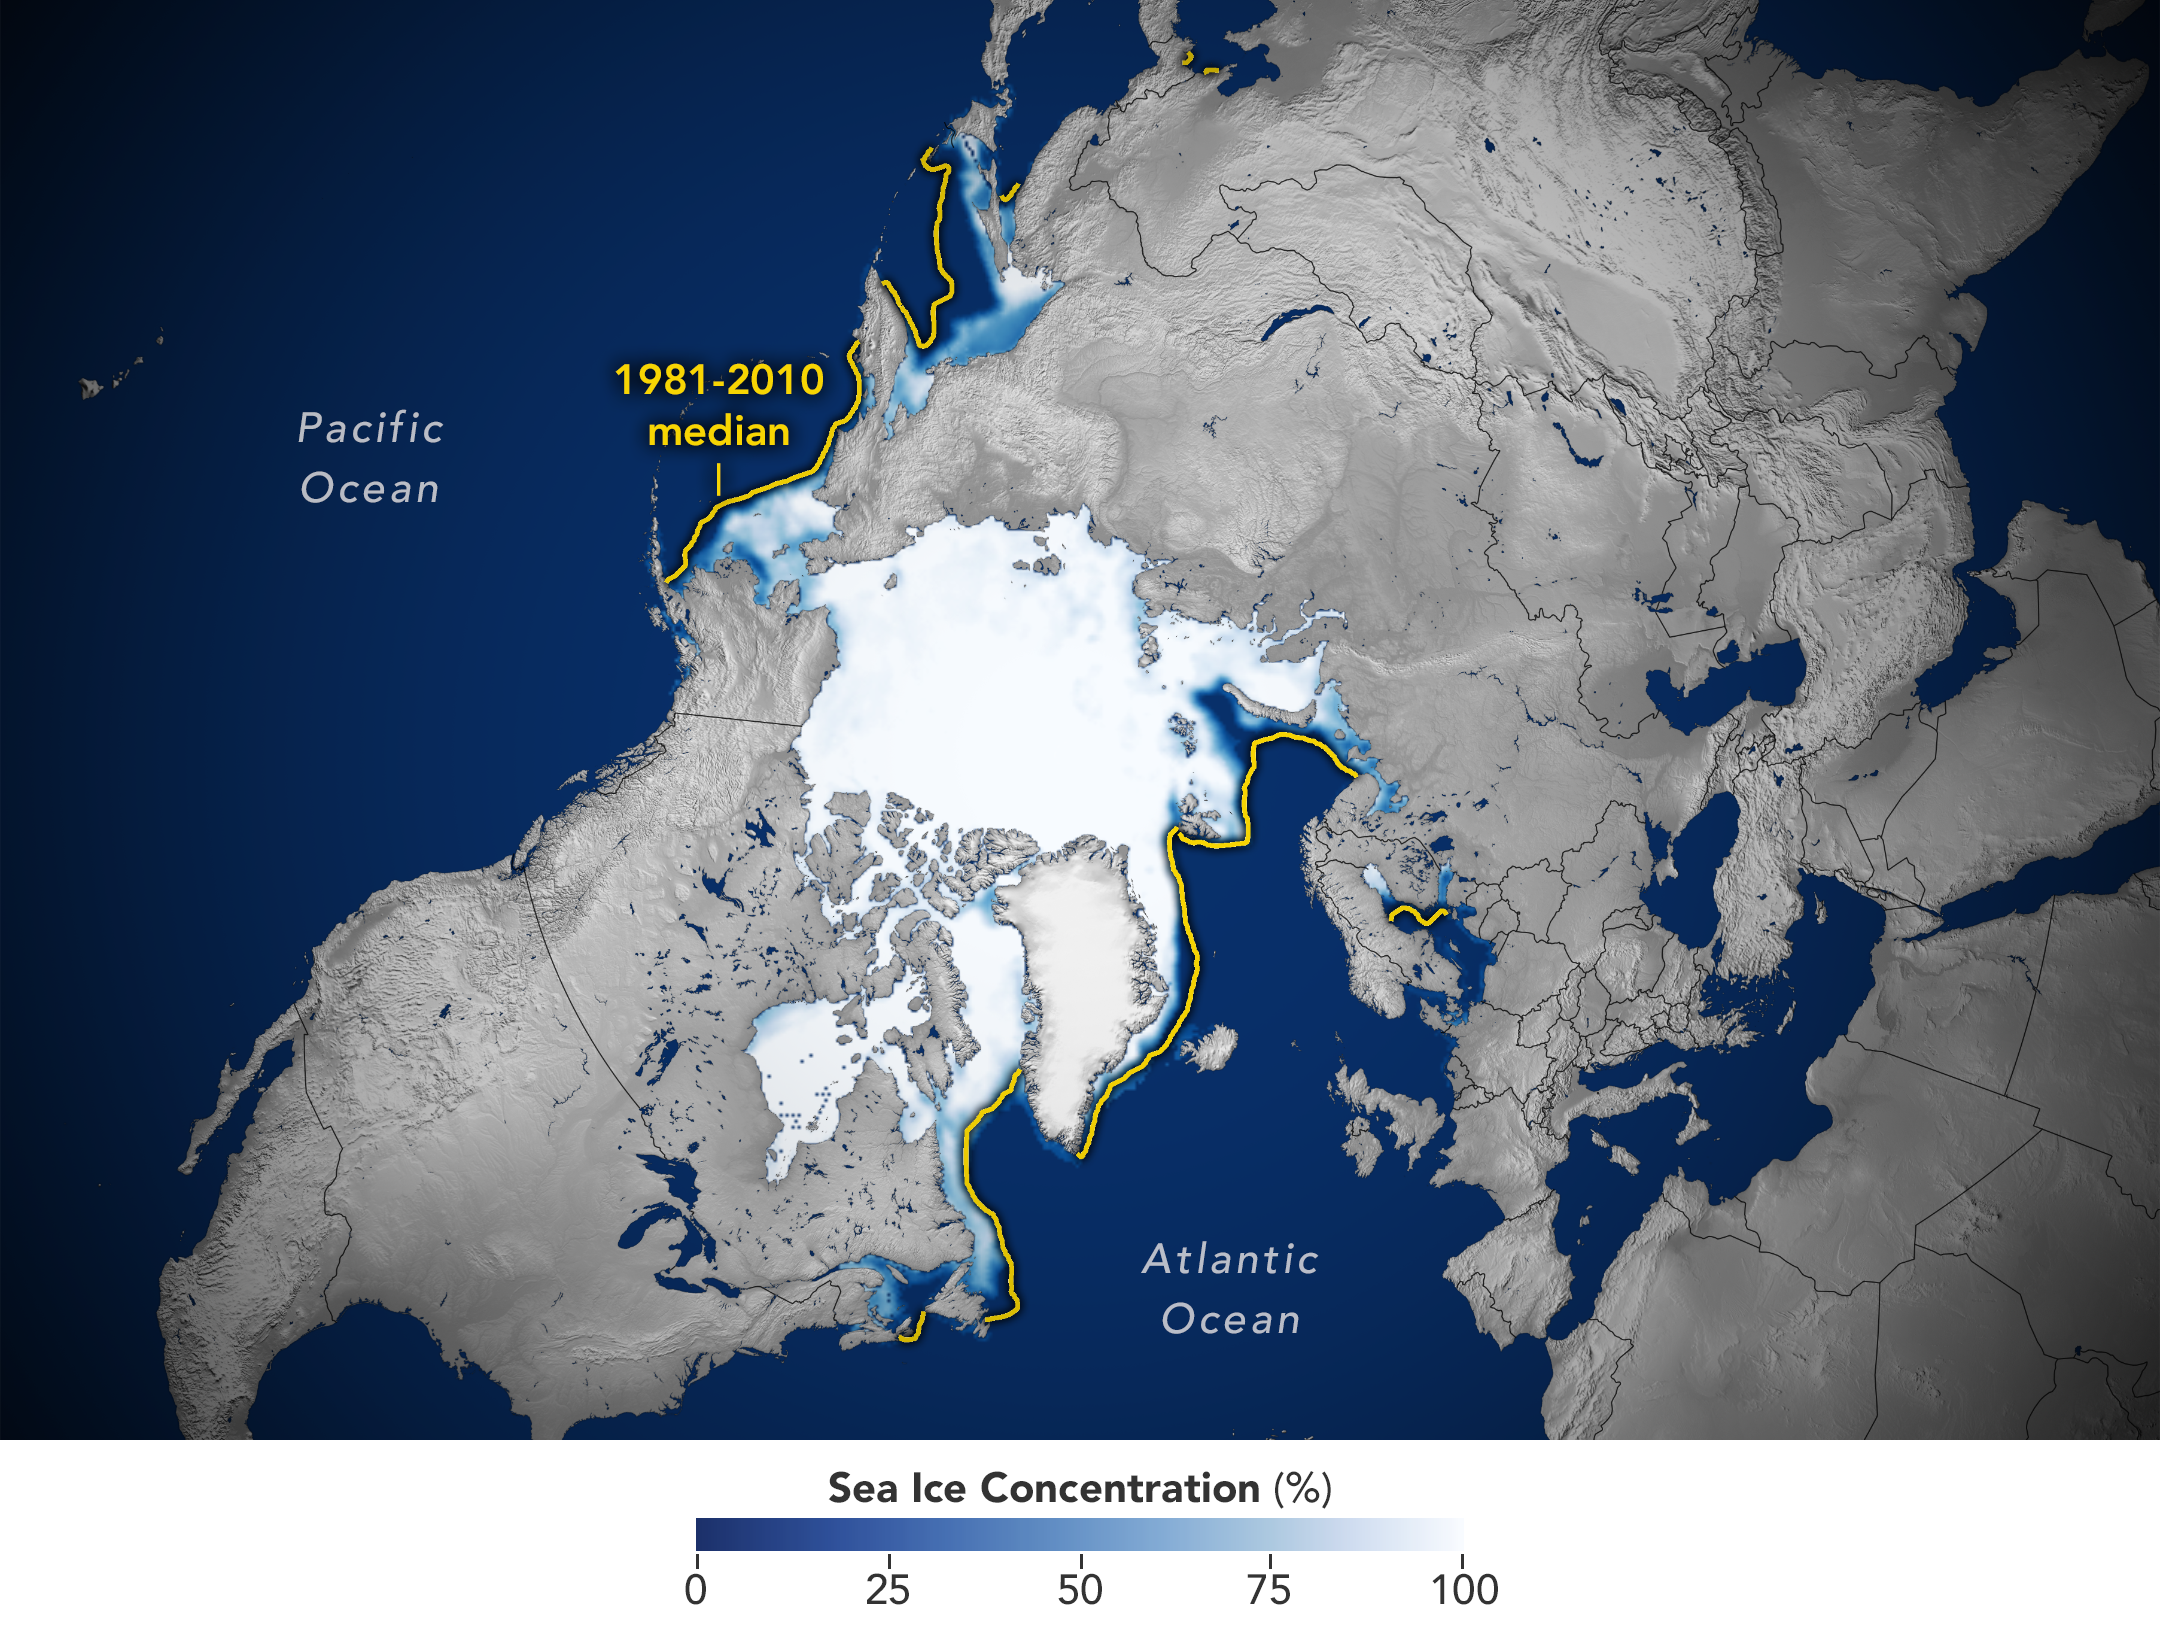
The map above shows the average concentration of Arctic sea ice on February 25, 2022, as derived from satellite data. The yellow outline shows the median sea ice extent for the month of March (1981 to 2010), when the ice generally reaches its maximum extent. A median is the middle value: That is, half of the extents were larger than the yellow line, and half were smaller.
Every year, the cap of frozen seawater floating on top of the Arctic Ocean and neighboring seas melts during the spring and summer and grows in the fall and winter. That ice reaches its maximum extent around March after growing through months of cold winter darkness; it shrinks to its minimum extent in September. In the Southern Hemisphere, Antarctic sea ice follows an opposite cycle.
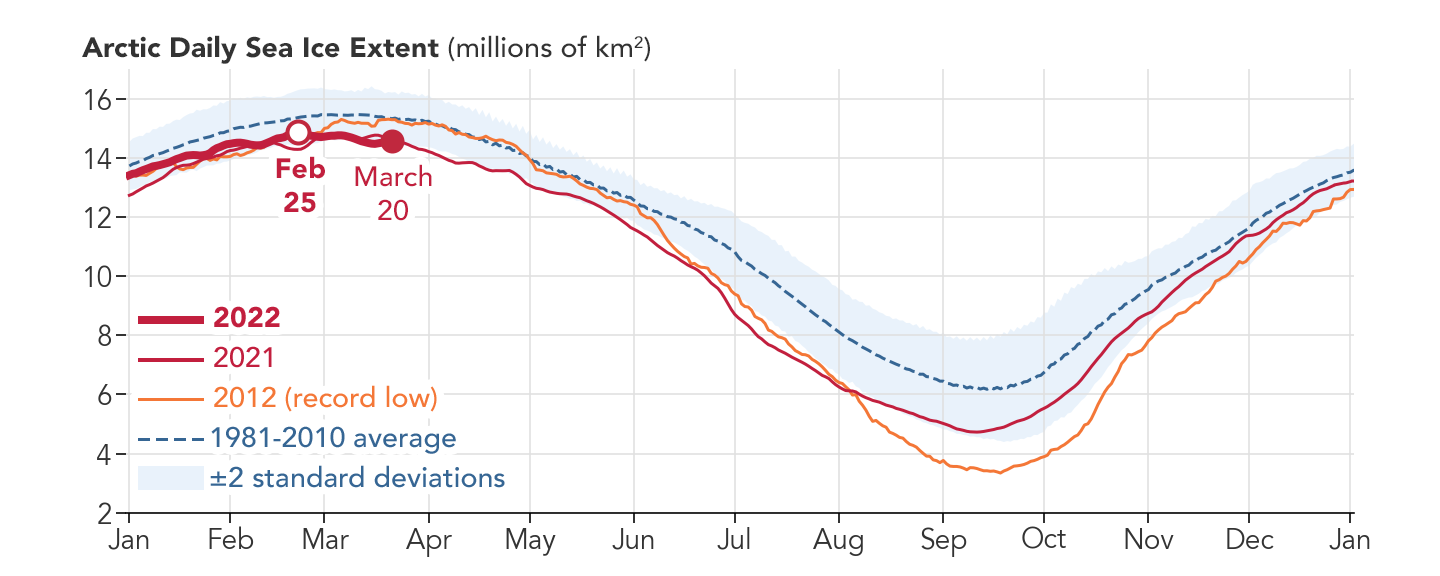
To estimate sea ice extent, satellite sensors gather data that are processed into daily images, with each image grid cell spanning an area of roughly 25 kilometers by 25 kilometers (15 miles by 15 miles). Scientists then use these images to estimate the extent of the ocean where sea ice covers at least 15 percent of the water. The graph above shows Arctic daily sea ice extent in 2022, 2021, and 2012 compared to the 1981–2010 average.
Since satellites began reliably tracking sea ice in 1979, maximum extents in the Arctic have declined by roughly 13 percent per decade, with minimum extents declining about 2.7 percent per decade. These trends are linked to warming caused by human activities, such as emissions of heat-trapping carbon dioxide. Other NASA analyses show that the Arctic is warming about three times faster than other regions of Earth.
NASA Earth Observatory images by Joshua Stevens, using data from the National Snow and Ice Data Center. Story by Roberto Molar-Candanosa, NASA’s Earth Science News Team.