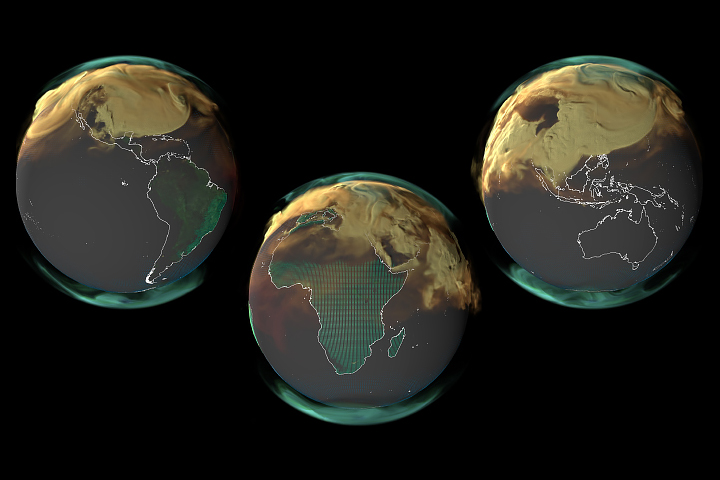
The amount of methane in Earth’s atmosphere has reached record levels in recent years. One of the major sources of emissions is the extraction, storage, and transportation of oil, natural gas, and coal, which results in the release of about 97 million metric tons of methane gas each year, according to the United Nations (U.N.). In a recent research project, scientists mapped where those emissions are coming from—not just by nations, but within them.
Methane is a potent greenhouse gas, trapping about 35 times more heat than carbon dioxide. The United States aims to reduce methane emissions 30 percent from 2020 levels by 2030, and other nations are making similar pledges.
Individual countries report their methane emissions by sector to the U.N. in accordance with the U.N. Framework Convention on Climate Change (UNFCCC). Most countries estimate their methane emissions using records of how much of each fossil fuel they produced each year, multiplied by an emissions factor provided by the Intergovernmental Panel on Climate Change (IPCC). And most governments only provide one number for emissions for each sector (oil, coal, gas) across the entire country.
Funded by NASA’s Carbon Monitoring System, scientists recently built a new series of maps detailing the geography of methane emissions from fossil fuel production. Using publicly available data reported in 2016, the research team plotted fuel exploitation emissions—or “fugitive emissions” as the UNFCCC calls them—that arise before the fuels are ever consumed. The maps delineate where these emissions occur based on the locations of coal mines, oil and gas wells, pipelines, refineries, and fuel storage and transportation infrastructure. The maps were recently published at NASA’s Goddard Earth Sciences Data and Information Services Center (GES DISC). (Note that 2016 was the most recent year with complete UN emissions data available at the time of this study.)
“It is widely known that the self-reported country estimates are not the highest quality,” said Tia Scarpelli, leader of the effort and a postdoctoral research fellow at the University of Edinburgh. “Our maps provide researchers with a spatial representation of methane emissions so that they can be compared with observations of methane concentrations from satellites.” Such maps are critical for monitoring changes in greenhouse gas emissions because the data tell scientists where to look and where to expect the most emissions.
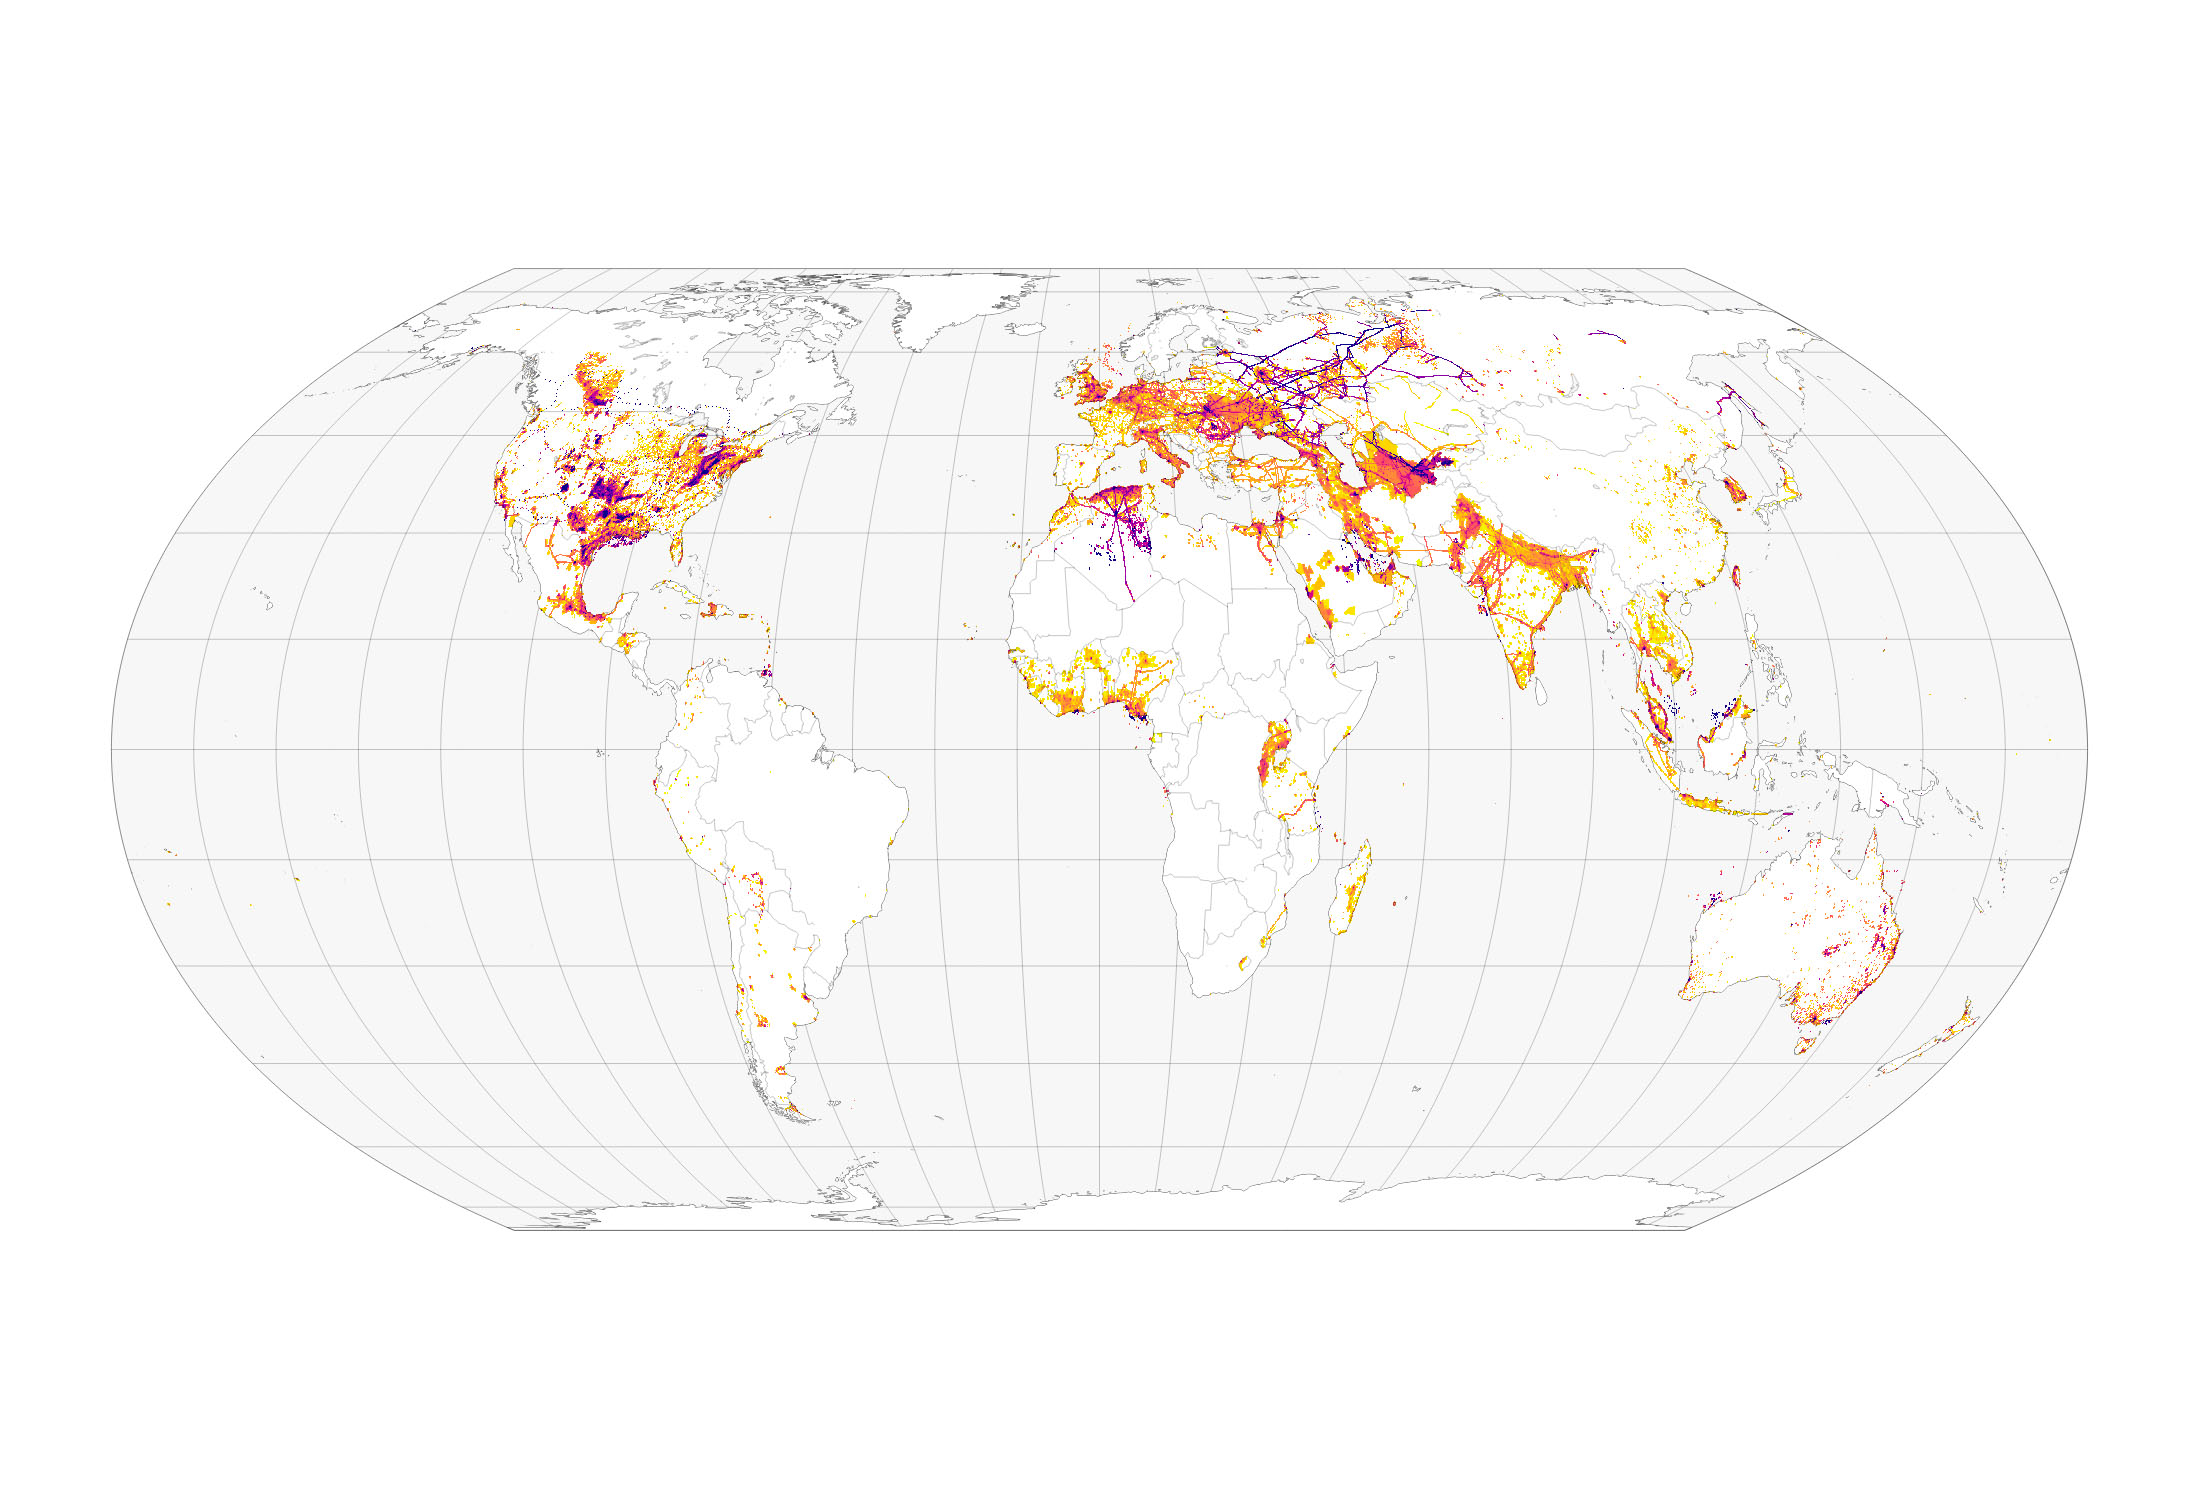
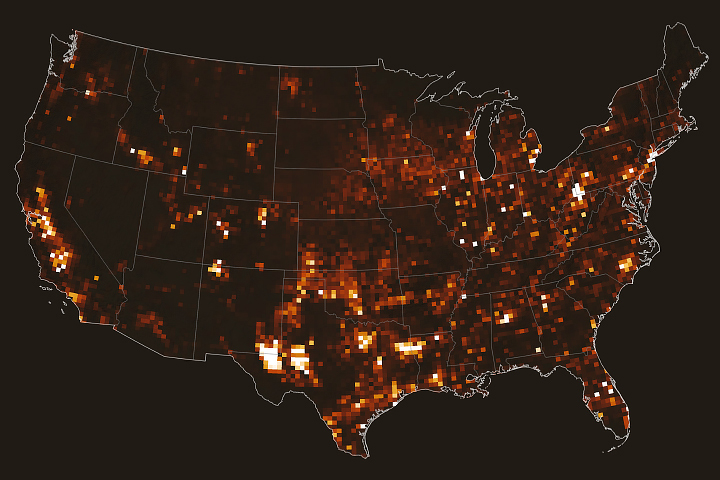
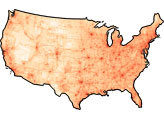
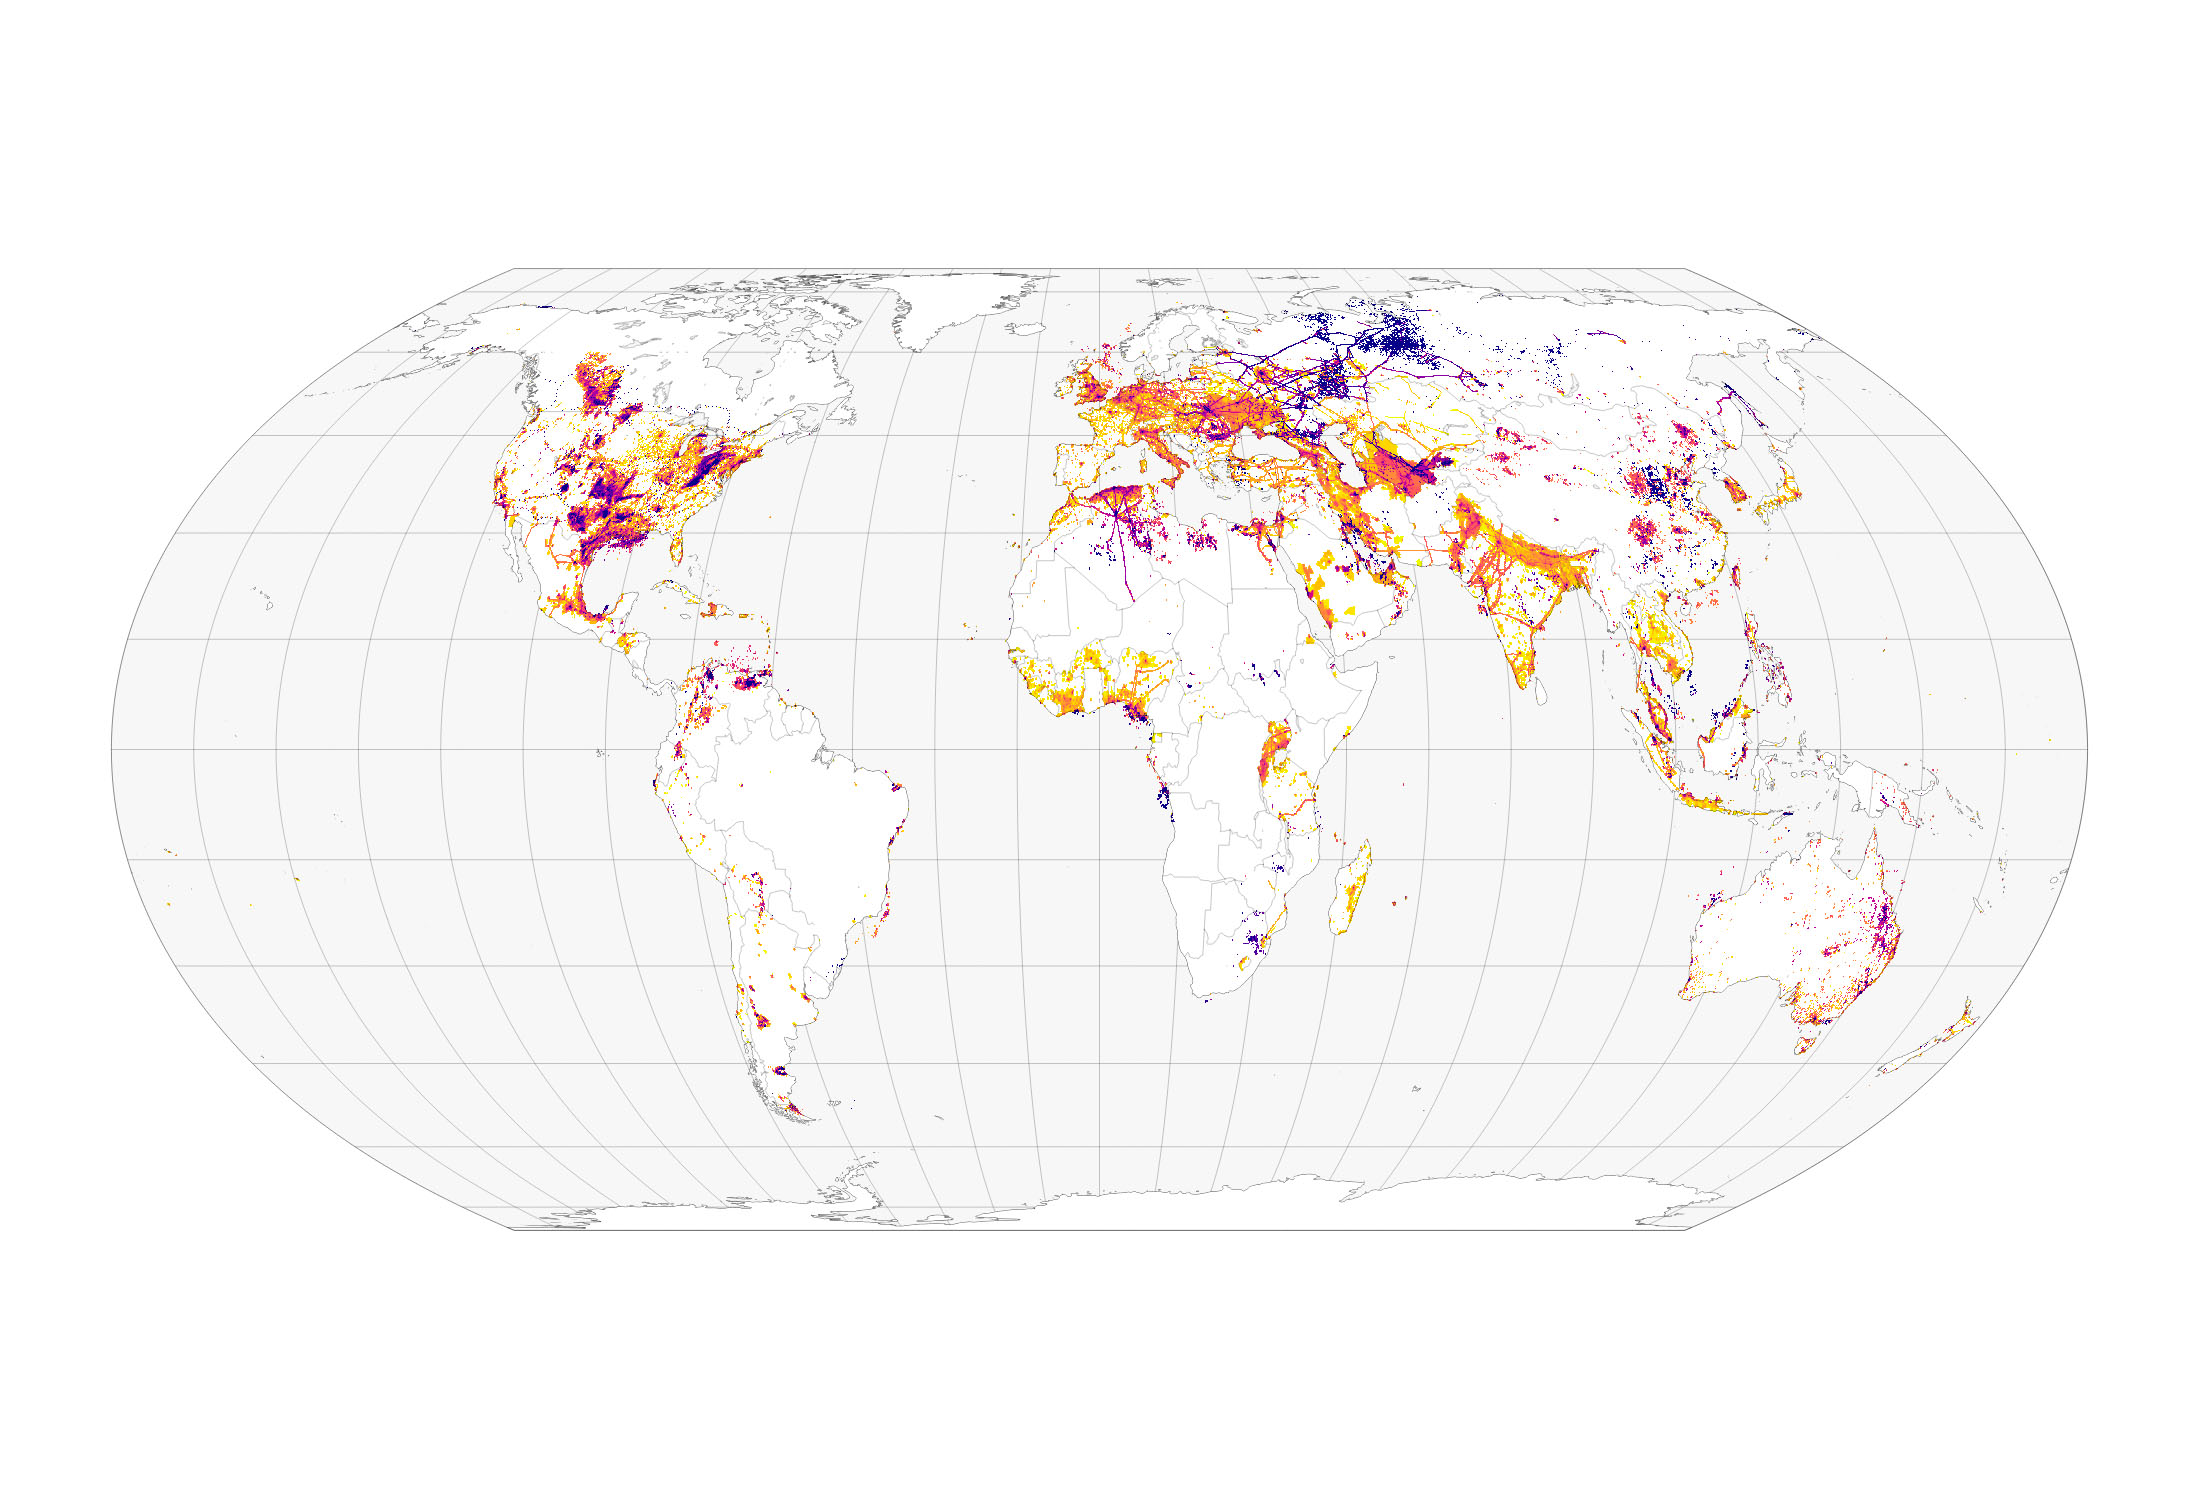
The maps indicate that the largest sources of oil-related emissions are found in Russia; the U.S. leads natural gas emissions; and coal emissions are highest in China. For oil and gas, the emissions are distributed across wells, flares, pipelines, refineries, and storage facilities. For coal, emissions are mapped to where it is mined.
Dark lines stand out on the map of natural gas emissions: these indicate the locations of pipelines. “Most of the emissions are not diffuse along the pipelines,” said Scarpelli, who led the research as a graduate student at Harvard University. “They are mostly coming from compressor stations that are present every hundred miles or so along pipelines to compress gas and keep it moving.” In Canada, dots in a line show locations of compressor stations. But for Russia, Scarpelli and colleagues did not have reports on the locations of the compressor stations or the pipelines. They had to digitize a paper map from the Harvard University library to map pipelines in Russia, and then distributed the methane emissions based on pipeline locations.
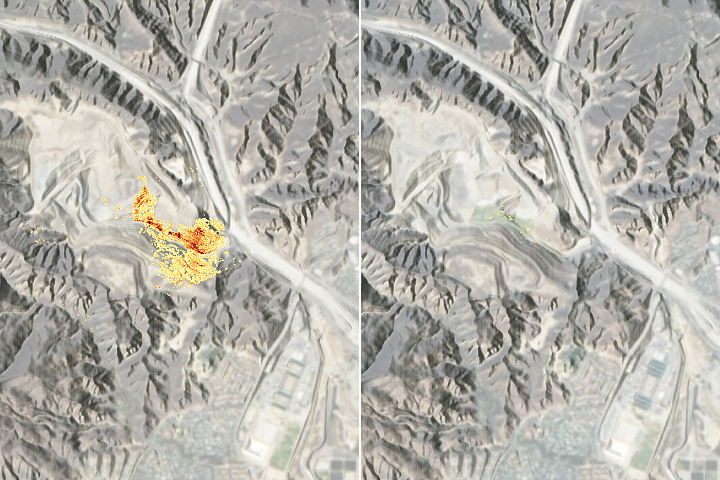
When comparing the new inventory to methane observations from the Japan Aerospace Exploration Agency’s Greenhouse gases Observing Satellite (GOSAT) and the European Space Agency’s Tropospheric Monitoring Instrument (TROPOMI) on Sentinel-5, Scarpelli’s colleagues at Harvard found that Canada and the U.S. tended to underestimate methane emissions from fossil fuels. But for coal in China and oil and gas in Russia, the inventory overestimated emissions. This could be because of uncertainties related to a lack of in situ observations and of accurate infrastructure data.
NASA Earth Observatory images by Joshua Stevens, using data from the Global Inventory of Methane Emissions from Fuel Exploitation. Story by Emily Cassidy, NASA Earth Science Data Systems Program.