

Even to the well-trained eye, deciphering the details in a natural-color satellite image can be perplexing. Are those green pixels a patch of deciduous trees or evergreens? Is that blue spot a lake or a wetland? And how are these land surfaces changing? Fortunately, there is no need to guess.
Since 2001, scientists with the U.S. Geological Survey (USGS) have issued satellite-derived maps every few years detailing the various types of land cover for every 30 square meters of Alaska and the conterminous United States—a product known as the National Land Cover Database (NLCD). Starting in 2006, USGS has been working with partners in Canada and Mexico to expand that effort and produce a similar type of map for the entire North American continent—known as the North American Land Change Monitoring System (NALCMS).
The joint initiative, supported by the Commission for Environmental Cooperation (CEC), provides a big-picture view of land cover types and how they change over time. The data have implications for studies in forestry, environmental and urban planning, biodiversity mapping, and climate change.
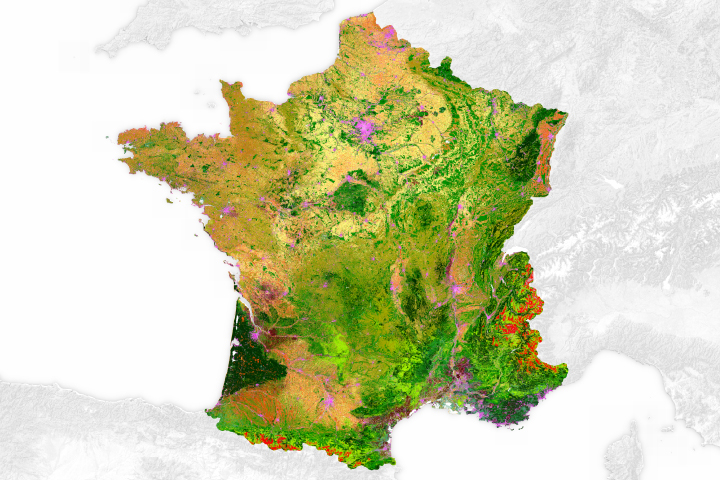
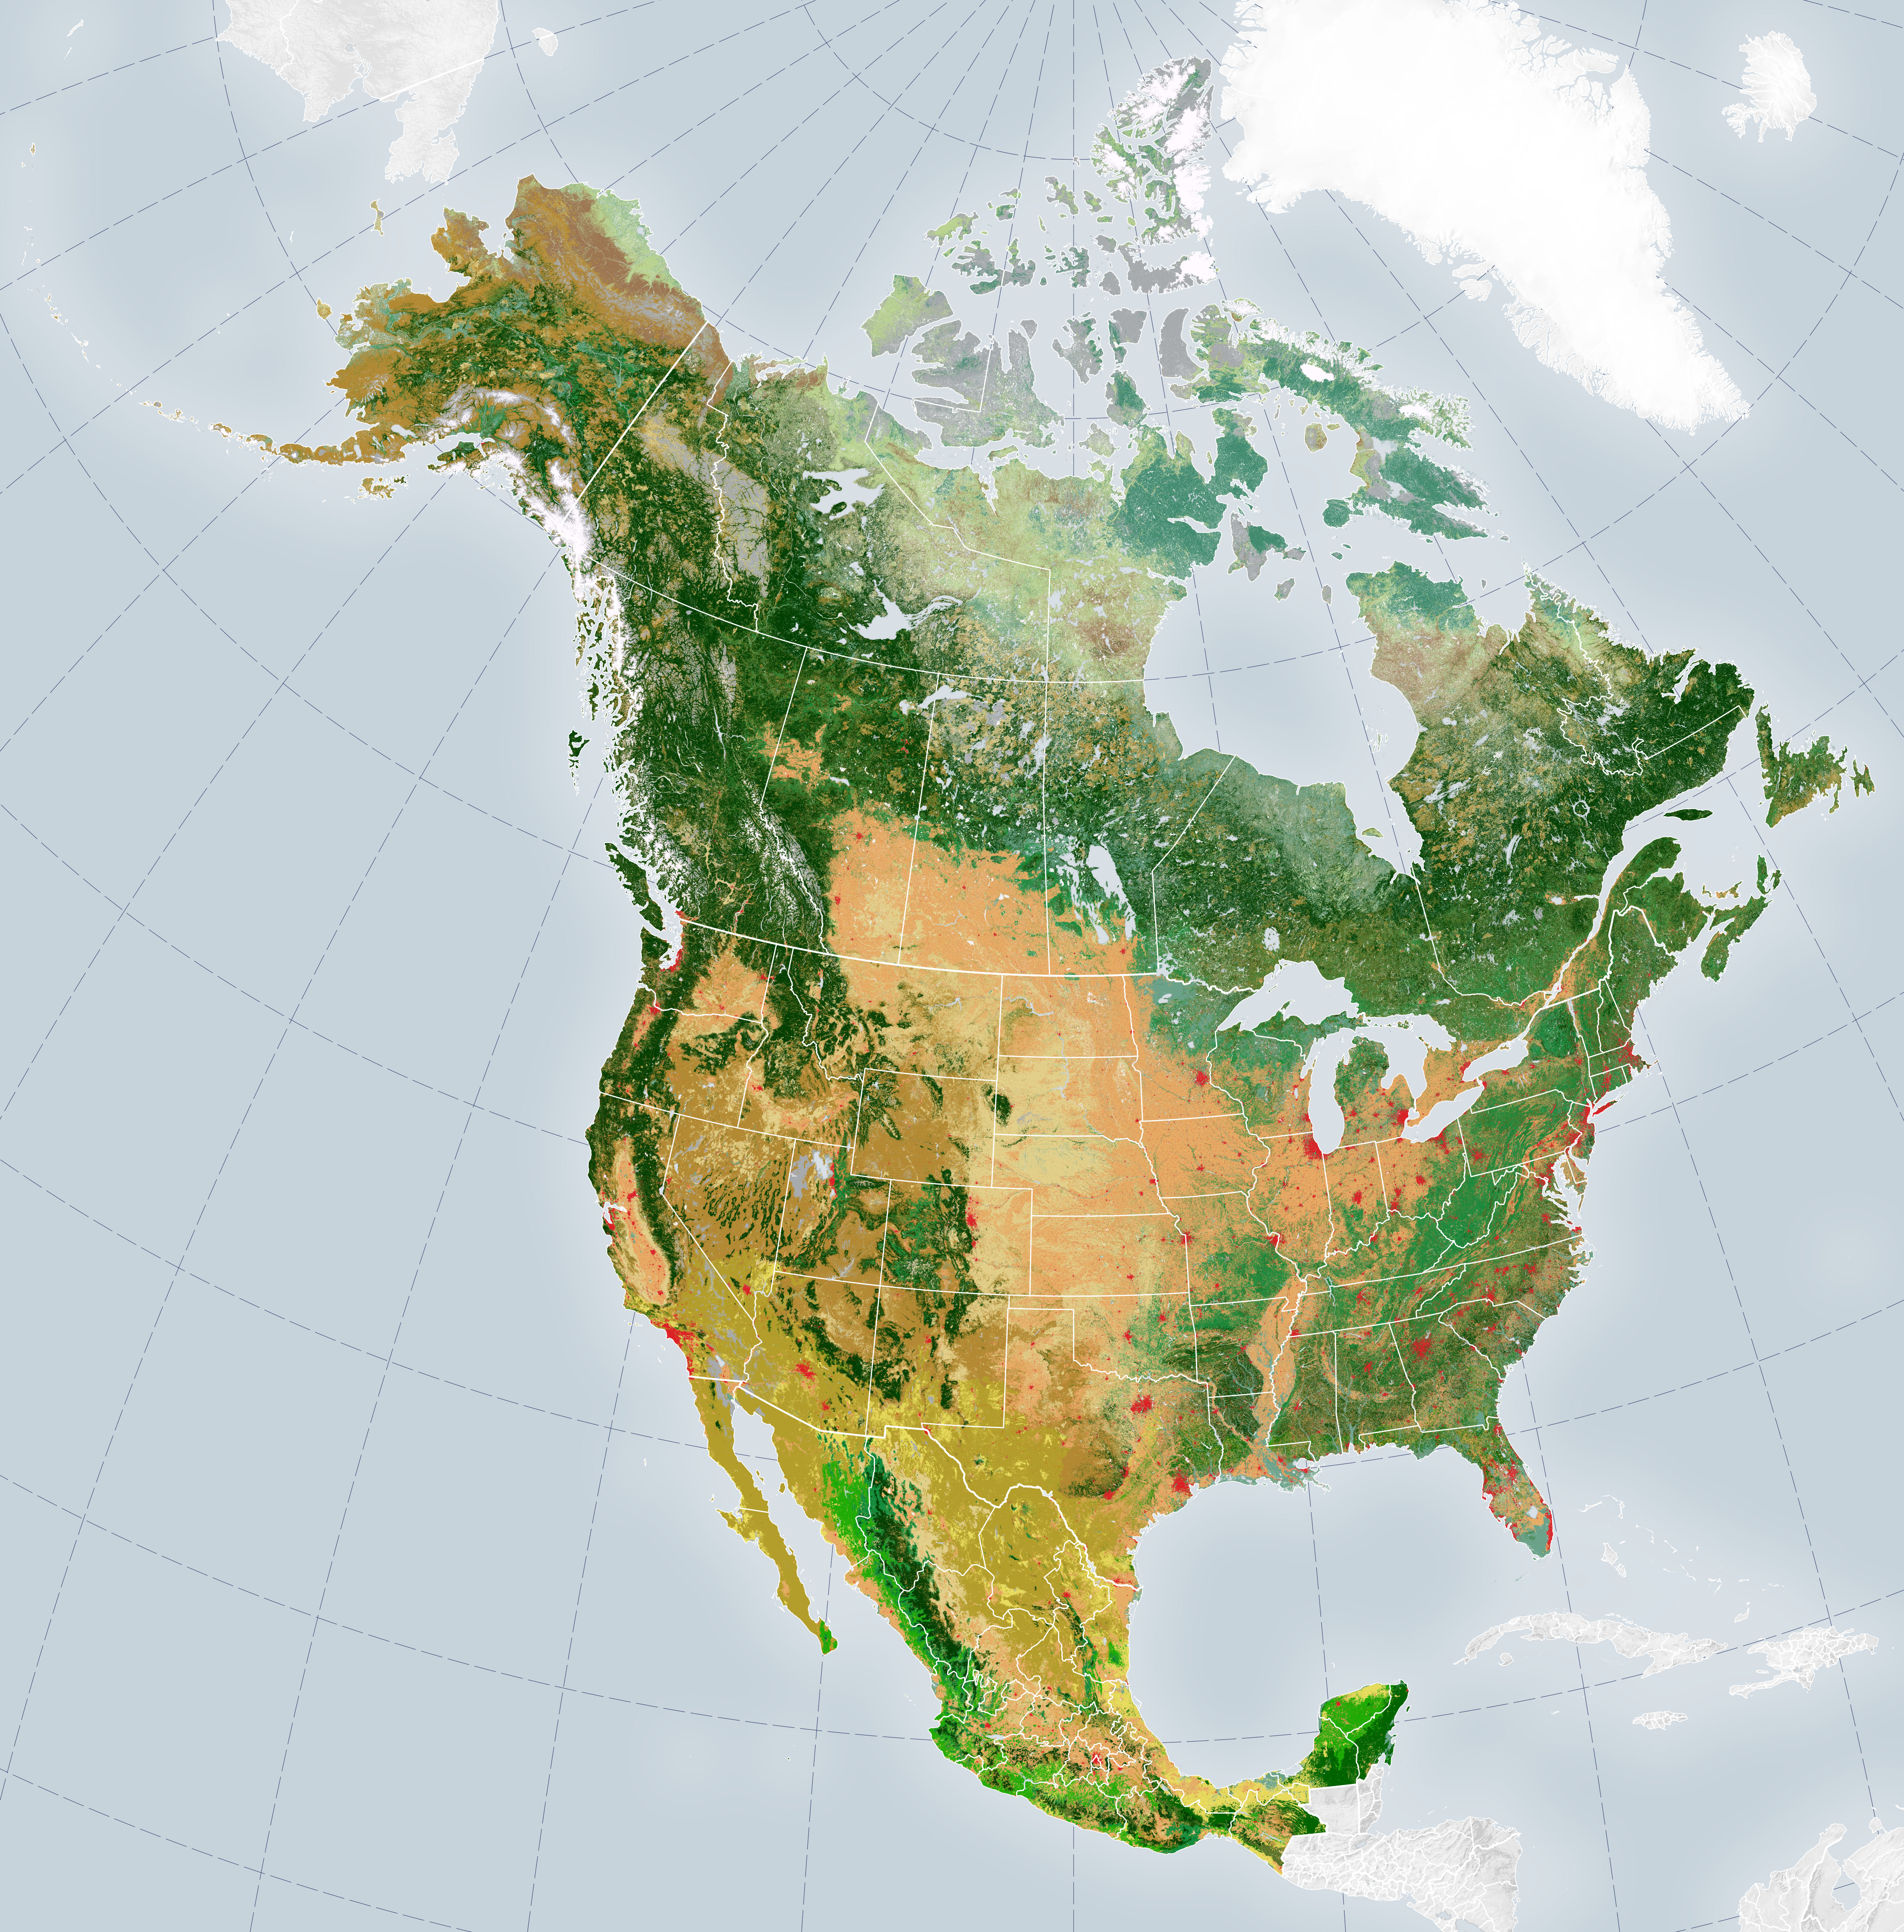
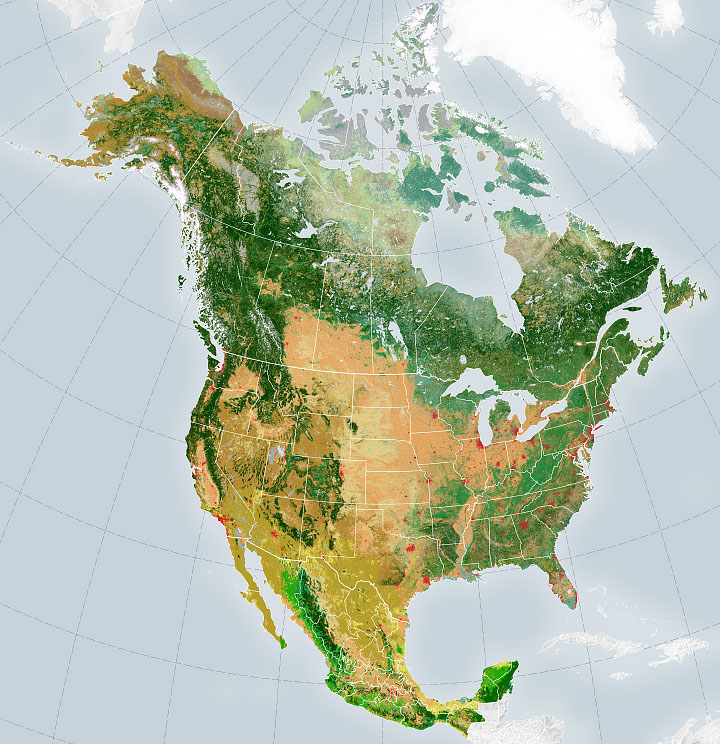
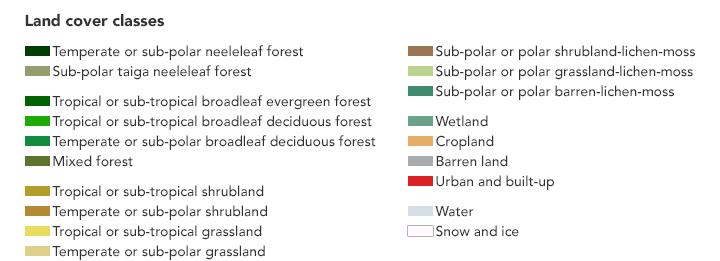
The maps above are the result of this international effort. They show the distribution of 19 land cover types across the North America in 2010 (left) and 2015 (right). In this wide view, the differences might appear subtle at first. But analysis of the changes shows some dramatic differences across five years: nearly 600,000 square kilometers (2.8 percent of North America) changed. The amount of forested land, wetlands, water bodies, and snow and ice decreased, while shrubland, grassland, cropland, barren land, and urban land cover increased.
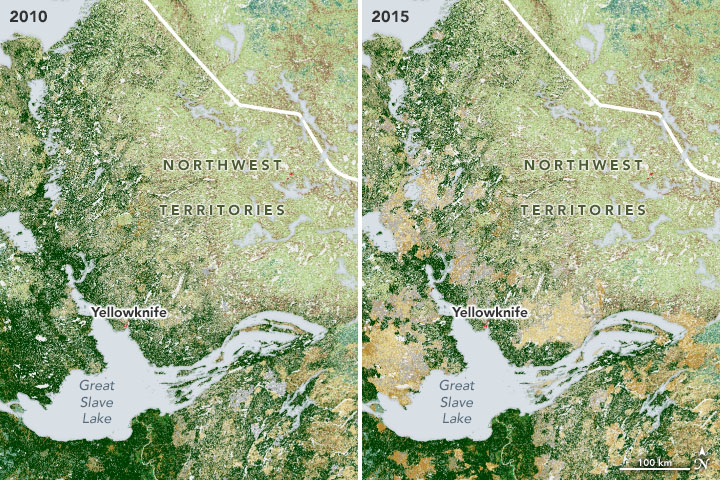
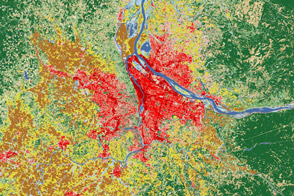
Closer inspection of the changes in specific areas can reveal some interesting patterns. For example, the detailed map above shows losses of forested land near Great Slave Lake in Canada’s Northwest Territories, primarily due to numerous destructive wildfires around the lake in 2014. The burned areas have since transitioned to barren land and grassland areas.
“I always find the change stories intriguing; the impact of wildfire is pervasive across the continent and insect defoliation is a key issue in Canada,” said Zakir Jafry, project lead at the CEC, which manages NALCMS. “Also on the human impact side, it’s interesting to see the growth of urban areas and transitions from grassland and shrubland to cropland.”
Producing the maps is no simple task. In the U.S. and Canada, the maps are derived from Landsat satellite images; in Mexico they are additionally derived from RapidEye imagery. To arrive at a seamless, unified map, Jafry explained, the data have to be “harmonized” across each of the three countries. That means identifying and correcting for spatial mismatches that can happen at borders. It also means standardizing the land cover classification scheme for all three countries. “It’s no small effort, and the harmonization process is considerable,” Jafry said.
Finally, there’s the tremendous amount of data involved. In the final 30-meter resolution maps, a land-cover classification type has been assigned to nearly 24 billion image pixels. And to arrive at those classifications, many more pixels had to be analyzed; pixels with clouds in them, for example, don’t tell you anything about the surface. For Canada alone, more than 36,000 Landsat scenes were processed and 665 billion pixels analyzed. The entire process, from analysis to final product, takes several years to complete.
“The NALCMS group produces the best available land cover products for North America to date,” Jafry said. “We have many users that depend on these data for research related to wildlife migration and habitat mapping, ecosystem monitoring, carbon sequestration analysis, and a number of other applications. All NALCMS products are available free-of-charge to the public for work and research.”
NASA Earth Observatory images by Joshua Stevens, using data from the North American Land Change Monitoring System, an international initiative supported by the Commission for Environmental Cooperation (CEC). U.S. Geological Survey partners include: Canada Centre for Mapping and Earth Observation (CCMEO, Natural Resources Canada); National Commission for the Knowledge and Use of Biodiversity (CONABIO); National Forestry Commission of Mexico (CONAFOR); and the National Institute of Statistics and Geography (INEGI). Story by Kathryn Hansen.