Editor’s Note—This article is one in a series about how NASA and other science institutions measure and monitor sea level rise. Find the other stories here.
Earth’s ice sheets and glaciers store a vast amount of water on land—as much as 69 percent of the planet’s fresh water, according to the U.S. National Snow & Ice Data Center. But when this ice melts and flows downslope, water once stored on land now contributes to the volume in the seas.
The planet’s seas have been rising for more than a century, with adverse effects such as increased coastal flooding, beach erosion, and saltwater intrusion into fresh groundwater supplies. There is more than one cause for the rise, but the largest contributor over the past few decades comes from the planet’s melting ice sheets and glaciers.
One way to track how much sea level rise comes from melting ice sheets and glaciers is to measure how much mass they are losing. Scientists have been making repeat ground-based measurements at select sites for decades—an approach that continues today and extends important long-term records of change. Traditional field measurements are also important for calibrating models and for understanding what causes the changes observed by satellites. But research has shown that field measurements can overestimate ice loss when they are used to extrapolate over larger areas with few observations.
In the past two decades, Earth-observing satellites have opened up new avenues for observing the planet’s changing ice masses and improving the frequency and coverage of measurements. The method that most directly measures the mass loss of glaciers and ice sheets is called gravimetry: scientists essentially “weigh” Earth’s ice by measuring its gravitational pull on a pair of satellites.
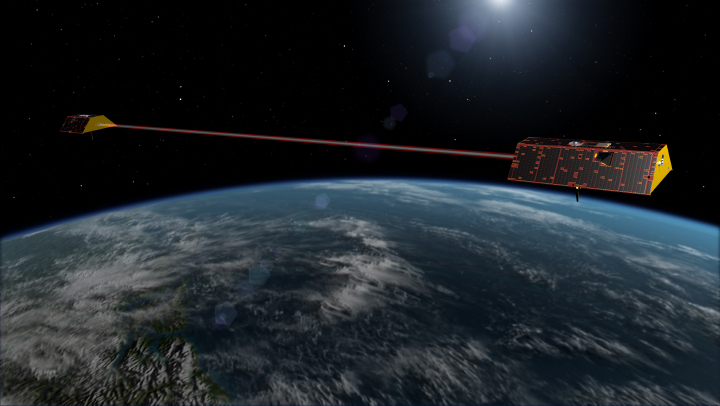
The main tools for this measurement have been the Gravity Recovery and Climate Experiment Follow On (GRACE-FO) satellites—a joint mission launched in 2018 by NASA and the German Research Center for Geosciences (GFZ)—and GRACE, a predecessor mission between NASA and the German Aerospace Center (DLR) from 2002 to 2017. The twin satellites in each mission detect subtle shifts in Earth’s gravity field. The strength of gravitational forces is determined by mass, so changes observed in Earth’s gravity field indicate a redistribution of mass. Such increases or decreases can be caused by changes in groundwater storage or by the decay of ice sheets and glaciers.
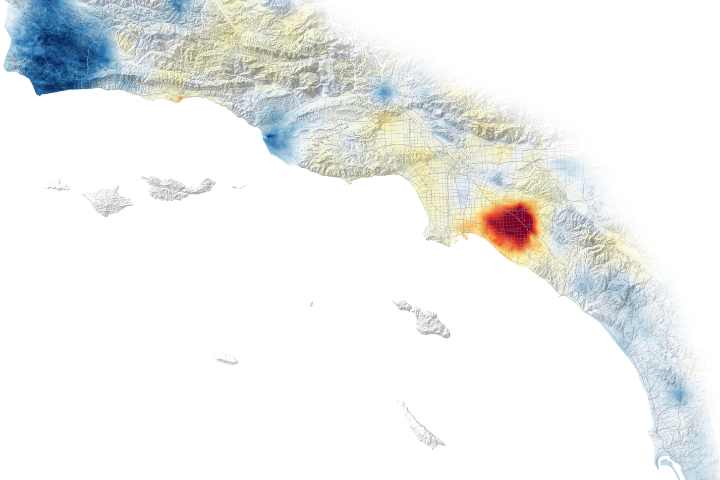
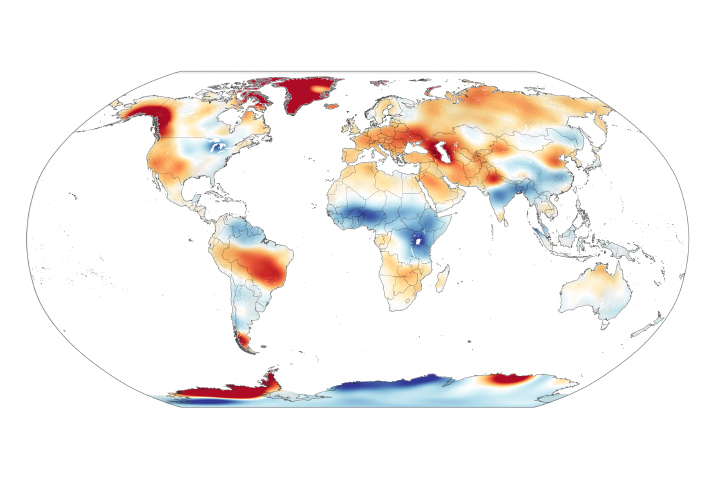
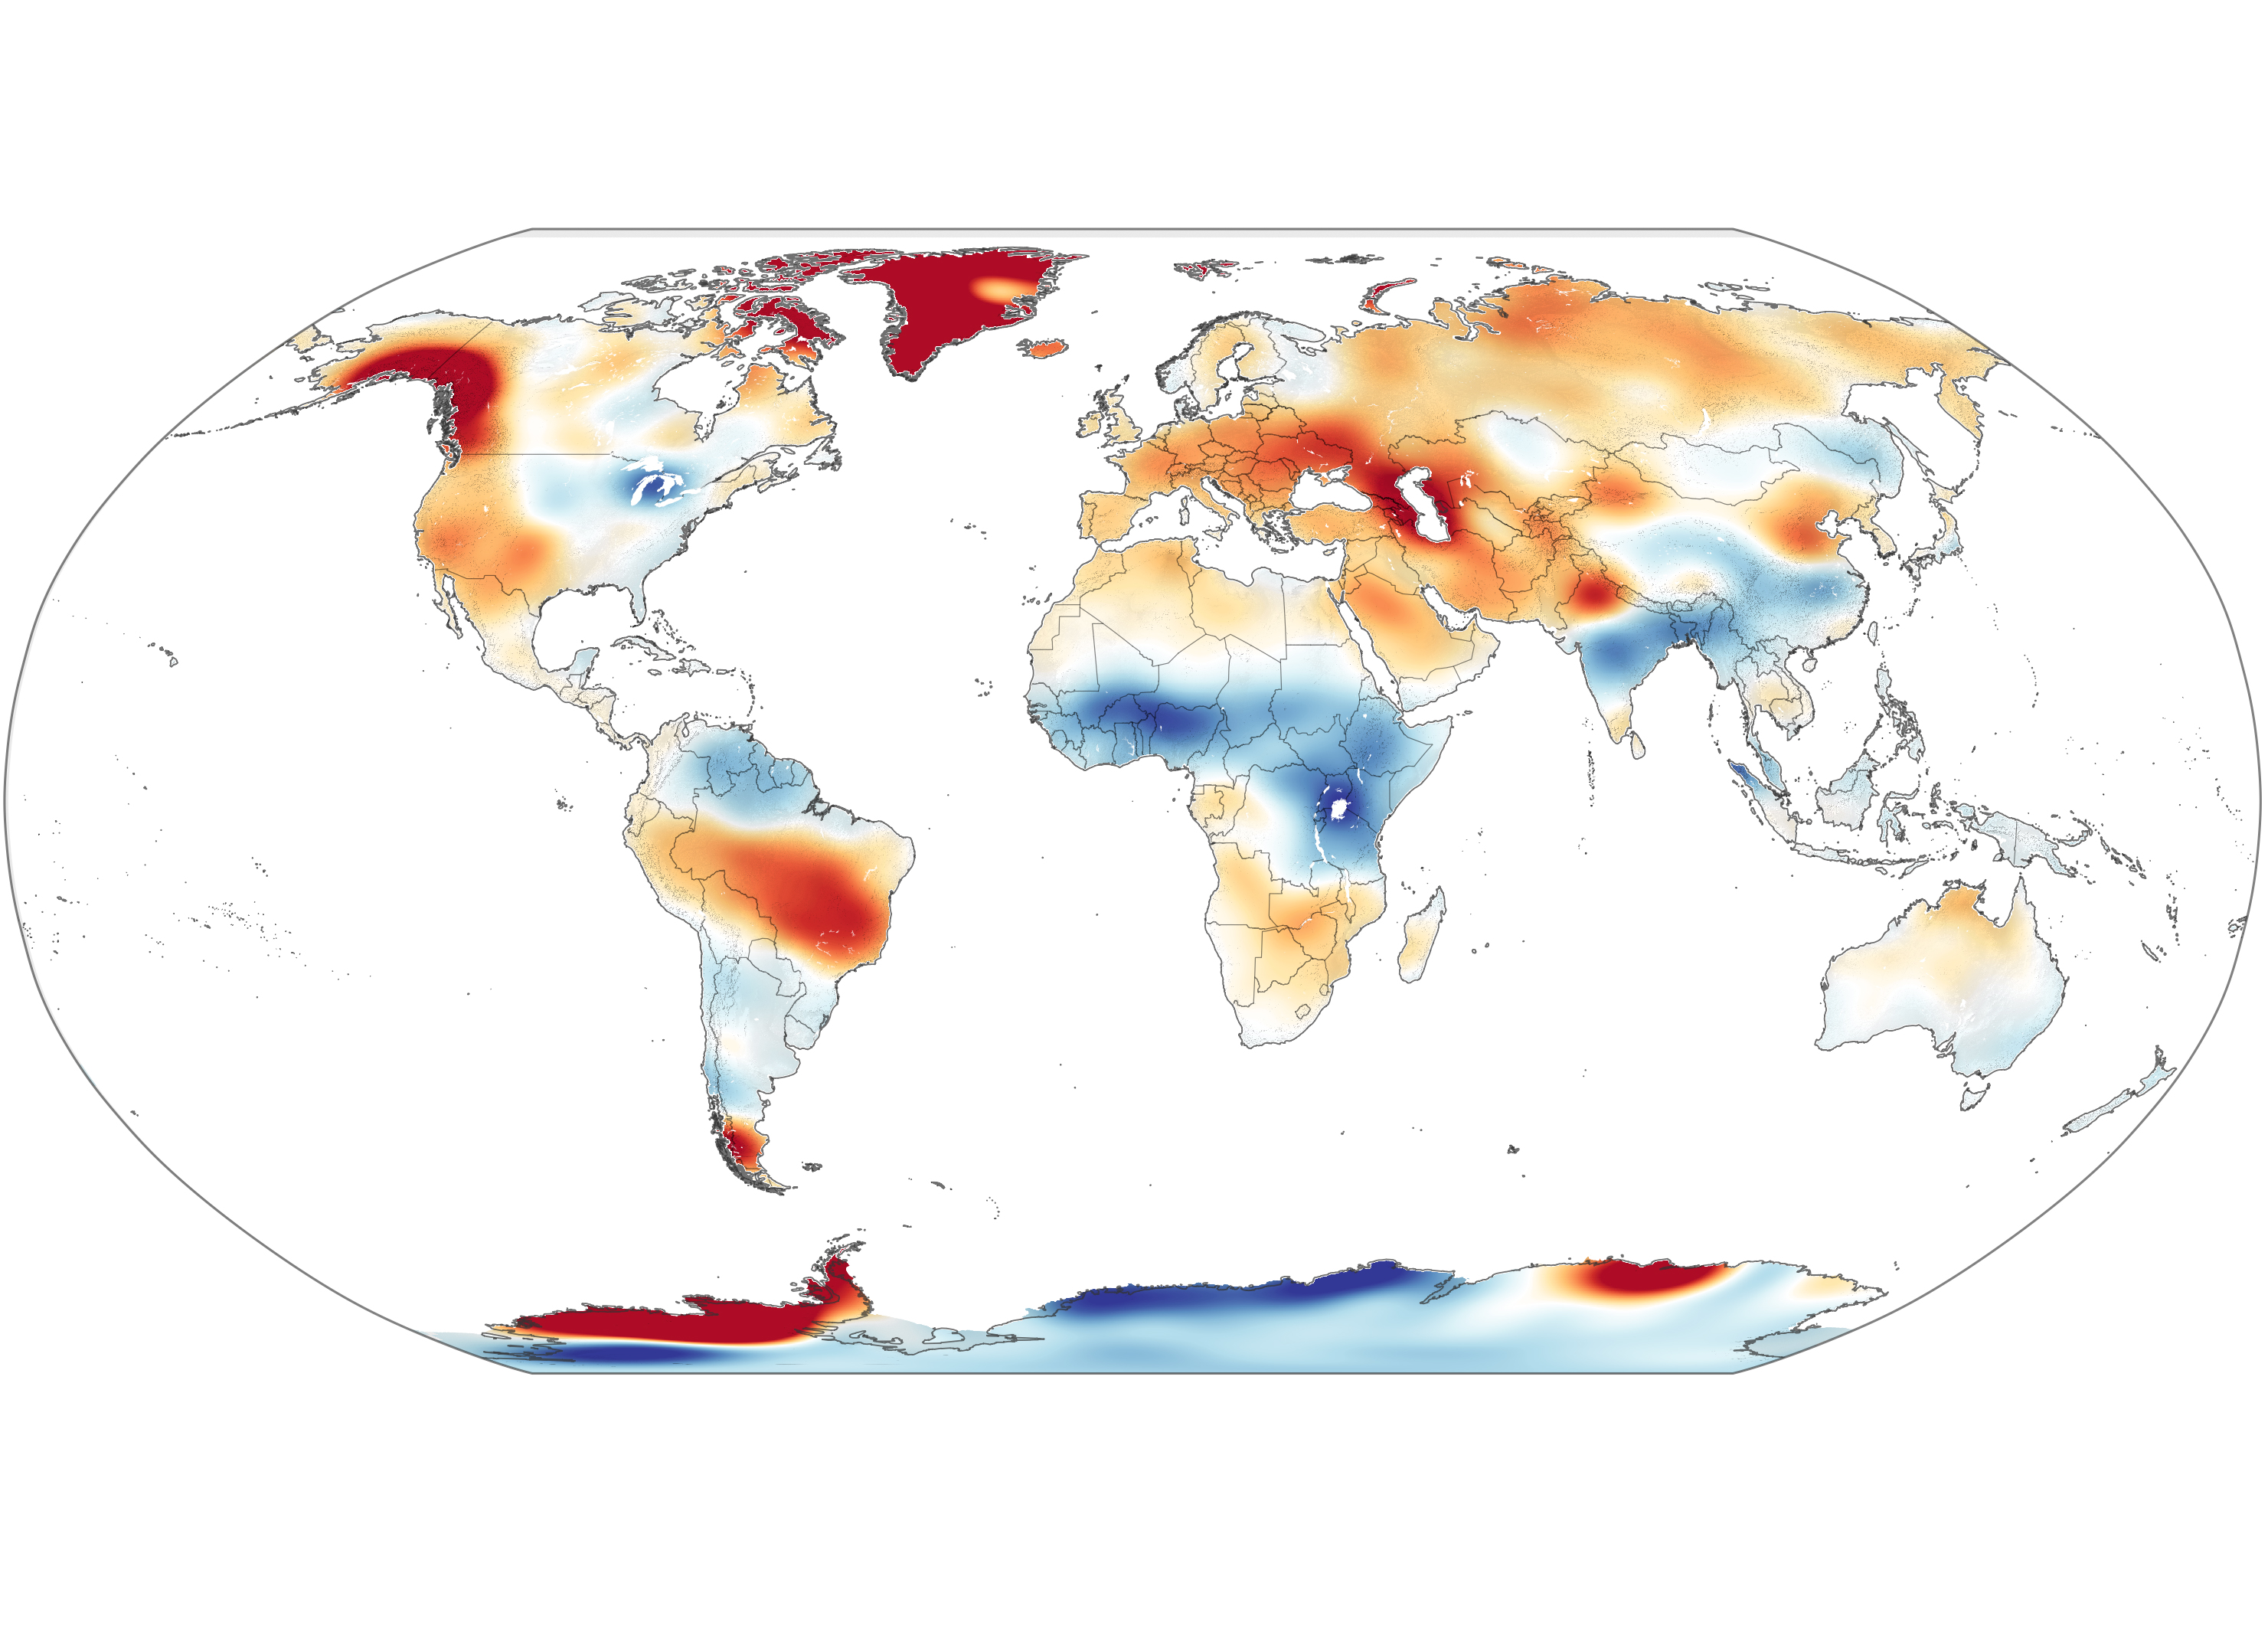
The map at the top of this page is based on data from GRACE and GRACE-FO satellites. It shows where the planet’s surface mass in August 2020 deviated from the average for all months between 2004 and 2009. Shades of red and orange indicate where Earth’s mass declined, mostly due to changes in the amount of water, including snow and ice. Blue areas show where mass grew. Notice that some of the most dramatic changes are focused in the ice-rich areas of West Antarctica, Greenland, and southeast Alaska.
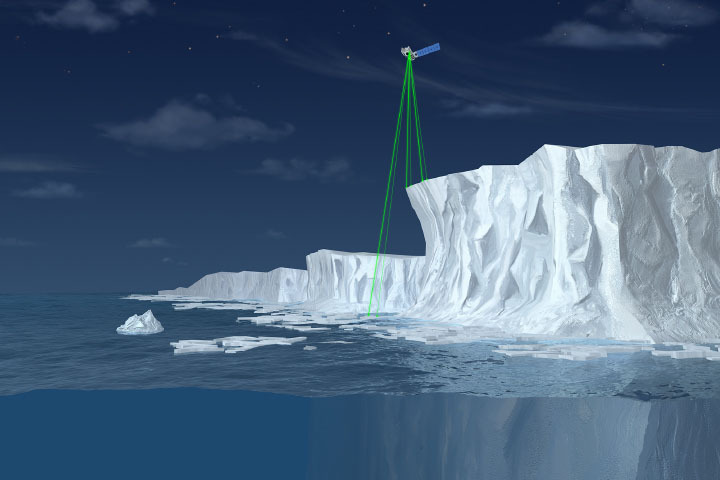
The GRACE missions each consist of two satellites at the same altitude, with one trailing the other in orbit by an average of 220 kilometers (140 miles), and orbiting Earth from pole to pole about 15 times a day. The key to the measurement is that the distance between the satellites varies ever so slightly depending on the mass of Earth’s surface below.
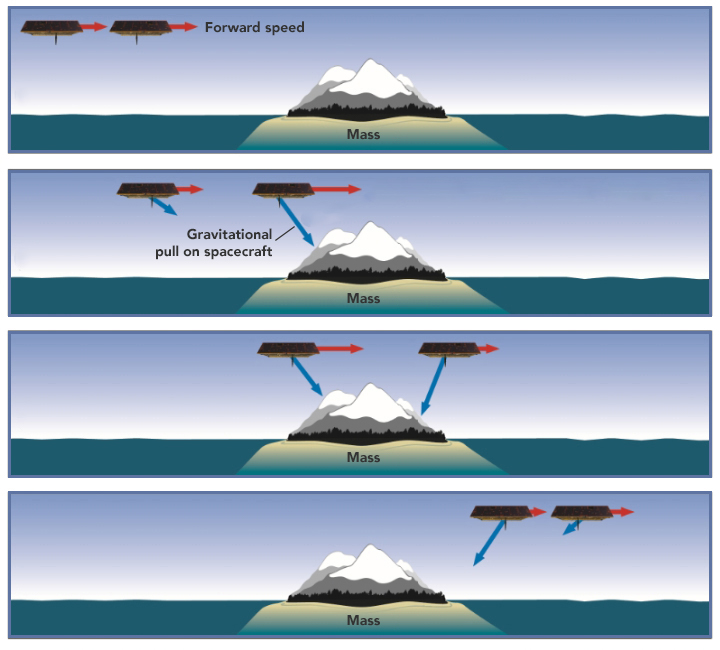
As the leading satellite passes over a large mass on Earth’s surface—such as a mountain range or ice sheet—the force of gravity pulls that satellite ahead slightly, accelerating it and increasing its distance from the trailing satellite (which is not yet affected by the same mass). After the leading satellite passes over the bump, it gets pulled back by gravity at about the same time that the trailing satellite is getting pulled ahead, decreasing the distance between them. These changes in separation—measured to within one micron by microwave ranging instruments on the satellites—are used by scientists to derive maps of Earth’s gravity and mass.
For scientists who study how Earth’s ice contributes to sea level rise, these general “mass anomaly” maps are useful, but not enough. Starting early in the first GRACE mission, scientists worked to isolate which gravity anomalies were caused by the mass of ice, as opposed to other factors such as the mass of mountains below the ice sheet. Once scientists had a few years of observations, they could begin to see how the mass of ice was changing.
Scientists now routinely use GRACE to study mass changes at the planet’s largest ice sheets in Greenland and Antarctica. From those measurements, they can calculate “sea level equivalent.” Changes in the mass of ice sheets and glaciers are typically measured in gigatons (Gt). They have figured out that the melting or calving of 1000 gigatons of land ice into the ocean raises global sea level by 2.8 millimeters.
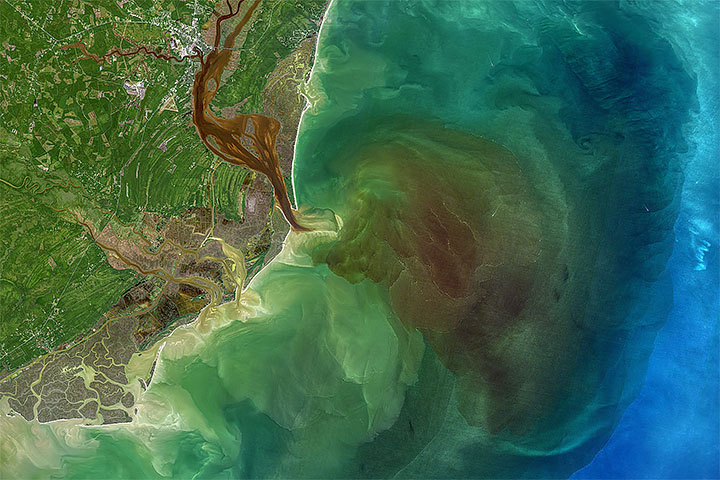
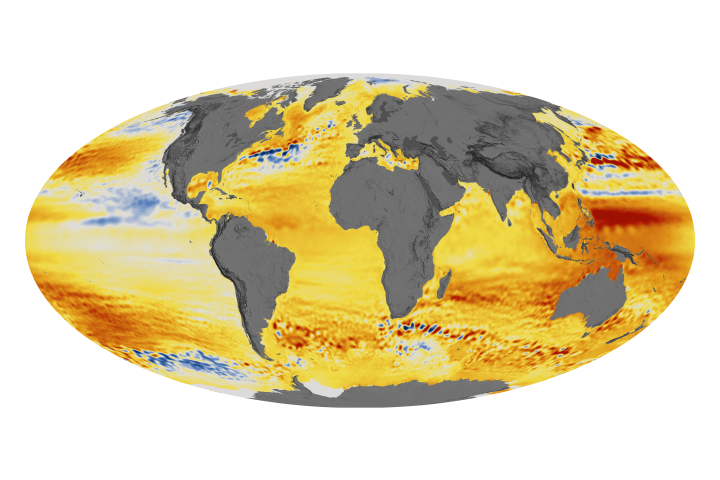
The map above shows mass losses across the Greenland Ice Sheet, as measured by the GRACE mission from 2002 to 2016. Research has shown that during that span, the ice sheet shed about 280 gigatons of ice per year, causing global sea level to rise by 11.2 millimeters (0.4 inches), or roughly 0.8 millimeters (0.03 inches) per year.
More recent GRACE-FO data indicate that Greenland has continued to lose a tremendous amount of ice. In just two months during the exceptionally warm summer of 2019, the island lost 600 gigatons of ice—more than double the average annual losses between 2002-2019.
Melting ice in Antarctica is also contributing to sea level rise. Between 2002 and 2017, scientists found that mass losses from the Greenland and Antarctic ice sheets combined to contribute about 1.2 millimeters per year to global mean sea level. That’s about one third of the total rise in sea level over that time.
Ice beyond Greenland and Antarctica has already been a significant contributor to sea level rise. In fact, melting glaciers have contributed more to sea level rise than the polar ice sheets since 1900, though that will likely change in the upcoming century. Scientists analyzing GRACE data found that mountain glaciers had lost about 200 gigatons of ice per year between 2002 and 2016, contributing 8 millimeters to global mean sea level.
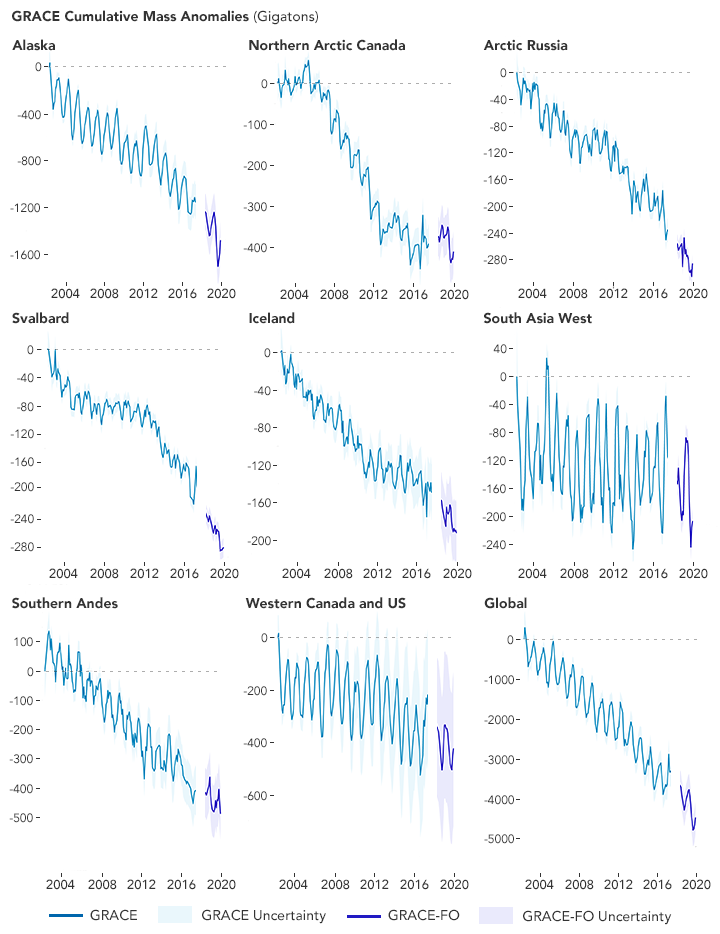
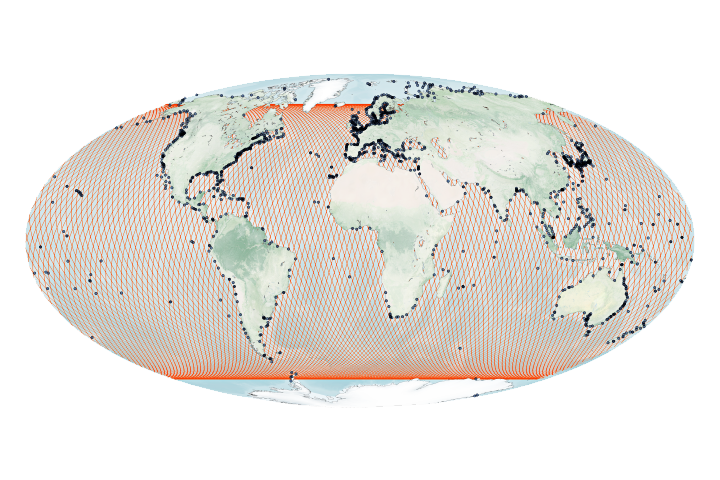
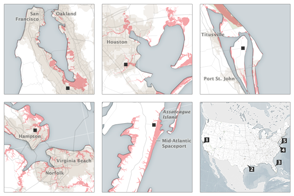
The figures above, derived from GRACE, show mass changes for some of these major glaciated regions beyond the poles. The largest mass losses occurred in Alaska. Other areas, such as western Canada and the United States, have seen changes that were relatively small until 2012, followed by a period of larger losses.
Scientists continue to refine their estimates from GRACE. For instance, they are constantly working to correct for glacial isostatic adjustment—the reshaping of Earth’s crust and redistribution of its mass as the weight of ice is reduced in some places. Gravimetry data are also converging with other measurements, such as laser altimetry, to show an increasingly complete picture of ice’s role in sea level rise, and which factors are most important and driving the observed changes. The modern data are even being used to help understand contributions to sea level rise in the past and to estimate the future evolution.
Find more stories about our changing oceans and coasts in Earth Observatory’s sea level rise collection. Explore other stories of sea level by our NASA colleagues in Rising Waters.
Looking for data related to sea level rise? The Sea Level Change Data Pathfinder on NASA’s Earthdata site highlights tools used by researchers to study ice mass anomalies, including data from the GRACE and GRACE-FO satellites .
NASA Earth Observatory images by Lauren Dauphin, using GRACE Monthly Land Water-Equivalent-Thickness Surface Mass Anomaly data from the Physical Oceanography Distributed Active Archive Center (PODAAC), and data from Wouters, Bert, et al. (2019). Animation by NASA’s Scientific Visualization Studio/Marit Jentoft-Nilsen. Story by Kathryn Hansen, with image and text support by Felix Landerer/NASA JPL, and Bert Wouters/TU Delft.