According to one estimate, there are more than 3.6 million lakes in the Arctic. They are remote and hard to reach and sample in the field, especially when they are covered with ice during the Arctic’s long winters.
Yet they are critically important to understanding climate change. As tiny organisms in Arctic lake sediments called archaea break down organic matter, they release methane, a potent greenhouse gas. Methane (CH4) has a heat-trapping power about 30 times stronger than carbon dioxide.
Finding the sources of methane around the world and measuring how much they are emitting has become an important scientific pursuit. Most attempts to measure methane emissions from lakes have focused on summer conditions when lakes are ice free, but the processes that produce the gas continue through the winter when many lakes are frozen.
“But the sheer number of Arctic lakes makes getting to them all impossible in any season,” explained Melanie Engram, a University of Alaska scientist. To get around this problem, Engram and colleagues have developed a new satellite-based technique to measure methane from lakes. The new technique makes use of L-Band synthetic aperture radar (SAR), a technology that involves bouncing microwaves off Earth’s surfaces and looking for changes in the reflection patterns observed by the satellite. The technique works even in cloudy conditions, if a layer of snow covers lake ice, or in darkness.
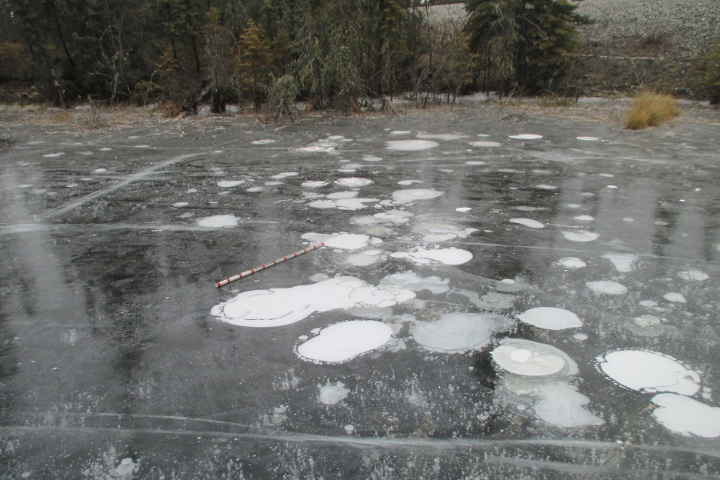
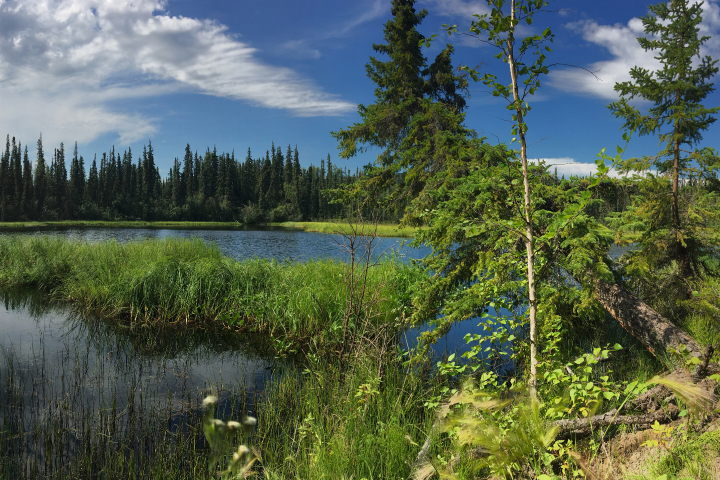
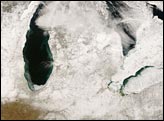
“When methane rises from the lake bottom, the columns of bubbles serve as insulators, slowing ice growth near the bubble column,” explained Engram. “Ice grows more quickly around the column, and you end up with these big divots beneath bubble columns that fill with water. Since water is especially reflective to microwave pulses, we are able to make measurements of how the waves bounce back after hitting the water divots to infer how much methane has bubbled up.” The photograph above shows an example of how methane bubbles in a frozen lake in Fairbanks, Alaska, can alter ice.
Using the SAR-based technique, Engram and colleagues calculated the methane flux—the rate of methane exchanged between the lake and the atmosphere—of 5,143 of the estimated 134,000 lakes in Alaska. To validate their satellite observations, they also made ground-based measurements at dozens of lakes near Barrow Peninsula, Atqasuk, Toolik, Northern Seward Peninsula, and Fairbanks, where they placed submerged “bubble traps” to measure methane emissions. The study was part of NASA’s Arctic-Boreal Vulnerability Experiment (ABoVE).
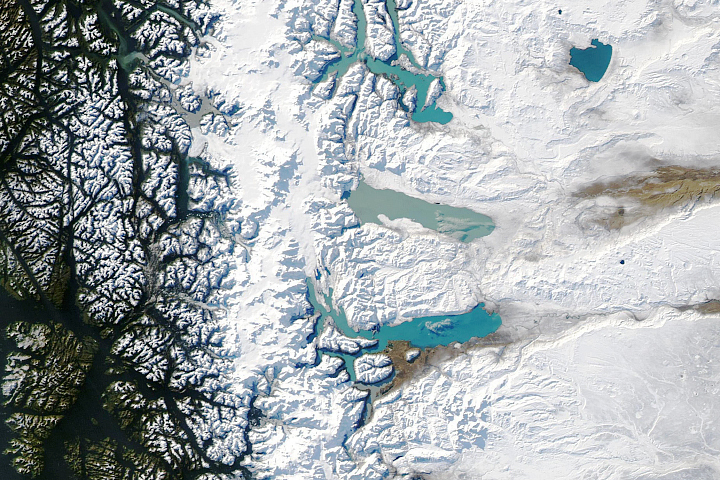
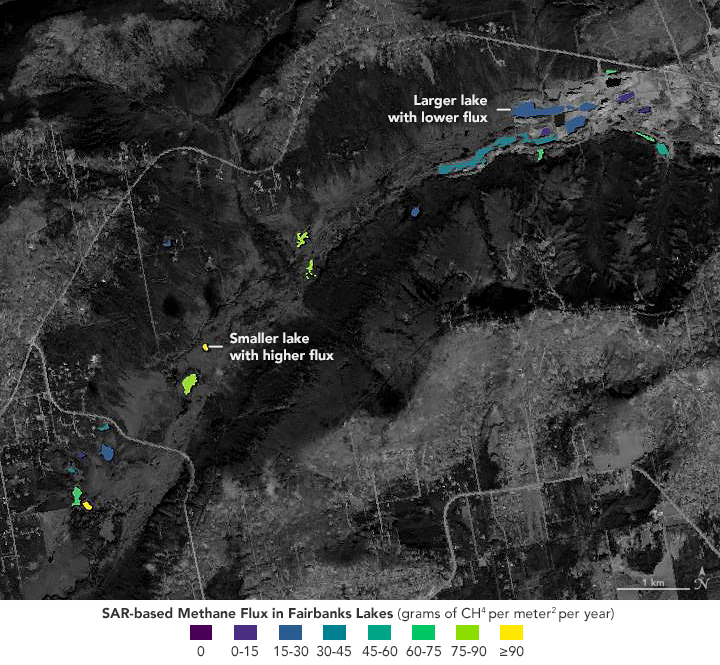
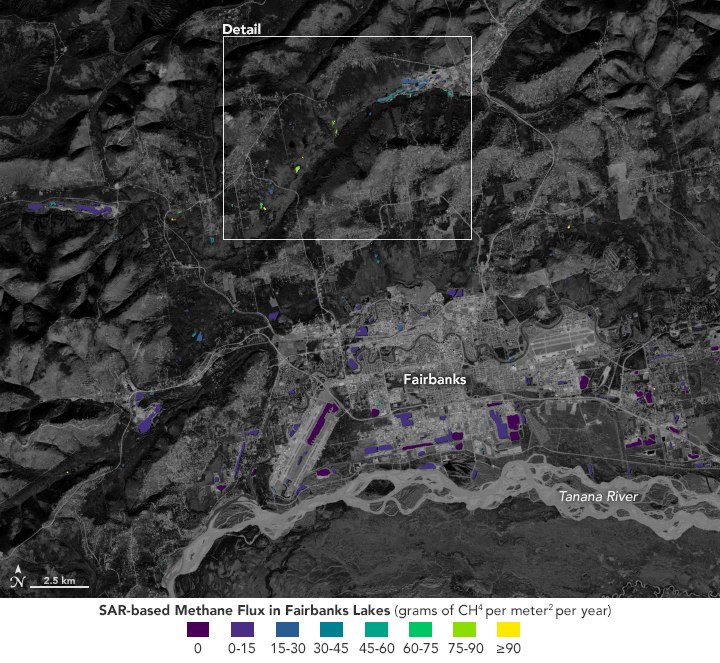
The team found that the smallest lakes tended to have the highest fluxes, but the larger lakes emitted more gas by volume. The map at the top of the page shows methane fluxes for the lakes surrounding Fairbanks—an area that stood out for the range of fluxes in its lakes. Several of the smaller lakes had fluxes that exceeded 90 grams per square meter per year; most of the larger lakes were between 0 and 15.
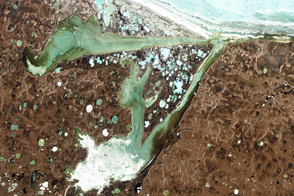
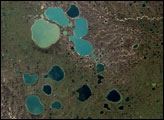
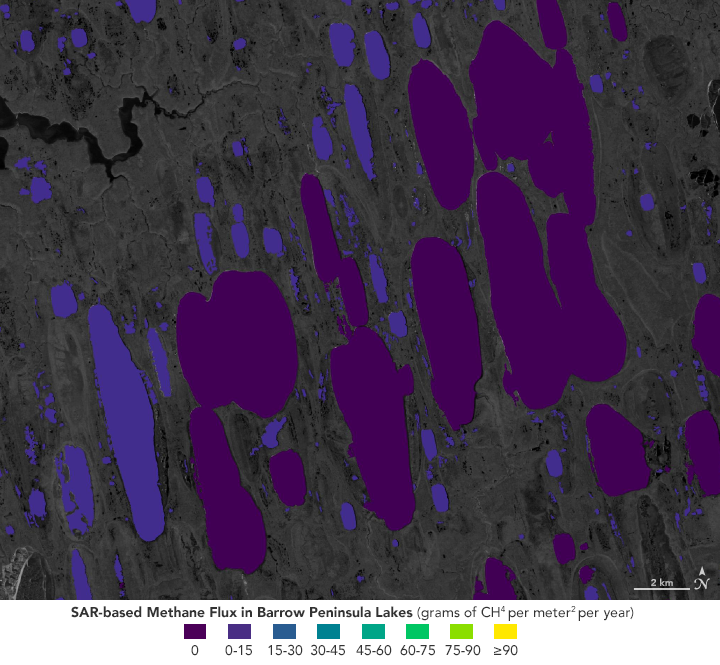
A key reason the small lakes around Fairbanks had such high fluxes is that they are located within yedoma—a type of Pleistocene-aged permafrost rich with organic material that releases significant amounts of methane when thawed. There are also some gravel-filled mining lakes around Fairbanks that have very low methane flux. In more northerly parts of Alaska, such as Barrow Peninsula (below), lakes tended to be larger, more numerous, and had a lower flux.
Measuring methane flux from Arctic lakes is part of a broader effort to better understand the methane budget—an accounting of how much of the gas is moving between various parts or the environment. Concentrations of methane in the atmosphere have risen significantly in recent decades, prompting scientists to try to understand why. Yet because there are several ways that methane enters the atmosphere, pinpointing the sources of the increase is difficult. Fossil fuel production, agriculture, fires, wetlands, thawing permafrost, and several other sources all emit methane and could be contributing to the buildup of the gas.
While Arctic lakes, wetlands, and permafrost are thought to be a modest source of methane, they are of particular concern because global warming could be increasing their share of emissions. Previous attempts to quantify methane flux from Arctic lakes have produced starkly different estimates. “Top-down” estimates, based on measurements from airplanes, satellites, and modeling, imply a flux rate that is two or three times lower than “bottom up” approaches, which are based on ground-based measurements at a limited number of lakes and then extrapolating across larger areas.
“This SAR work is really exciting because it is helping us resolve the big discrepancy between top-down and bottom-up estimate that we have had for years,” said Katey Walter Anthony, also of the University of Alaska. “These SAR results are showing us that some of the bottom-up estimates we did in the past were too high.”
Still, Engram and Walter Anthony caution that their SAR work has just begun, as they have analyzed less than 0.14 percent of the lakes in the Arctic. “We would love to extend our analysis to all Arctic lakes eventually,” she said. “There is plenty of SAR data available for Alaska, Canada, and Greenland. The biggest challenges will be Russia, the largest region of the Arctic, but where SAR coverage is very sparse.”
NASA Earth Observatory images by Lauren Dauphin, using data from Engram, Melanie, et al. (2020) and Landsat data from the U.S. Geological Survey. The researchers used data collected by the Phased Array type L-band Synthetic Aperture Radar (PALSAR) sensor on the Japanese Advanced Land Observing Satellite (ALOS). The data is processed and stored by the Alaska Satellite Facility at the University of Alaska Fairbanks. Story by Adam Voiland.