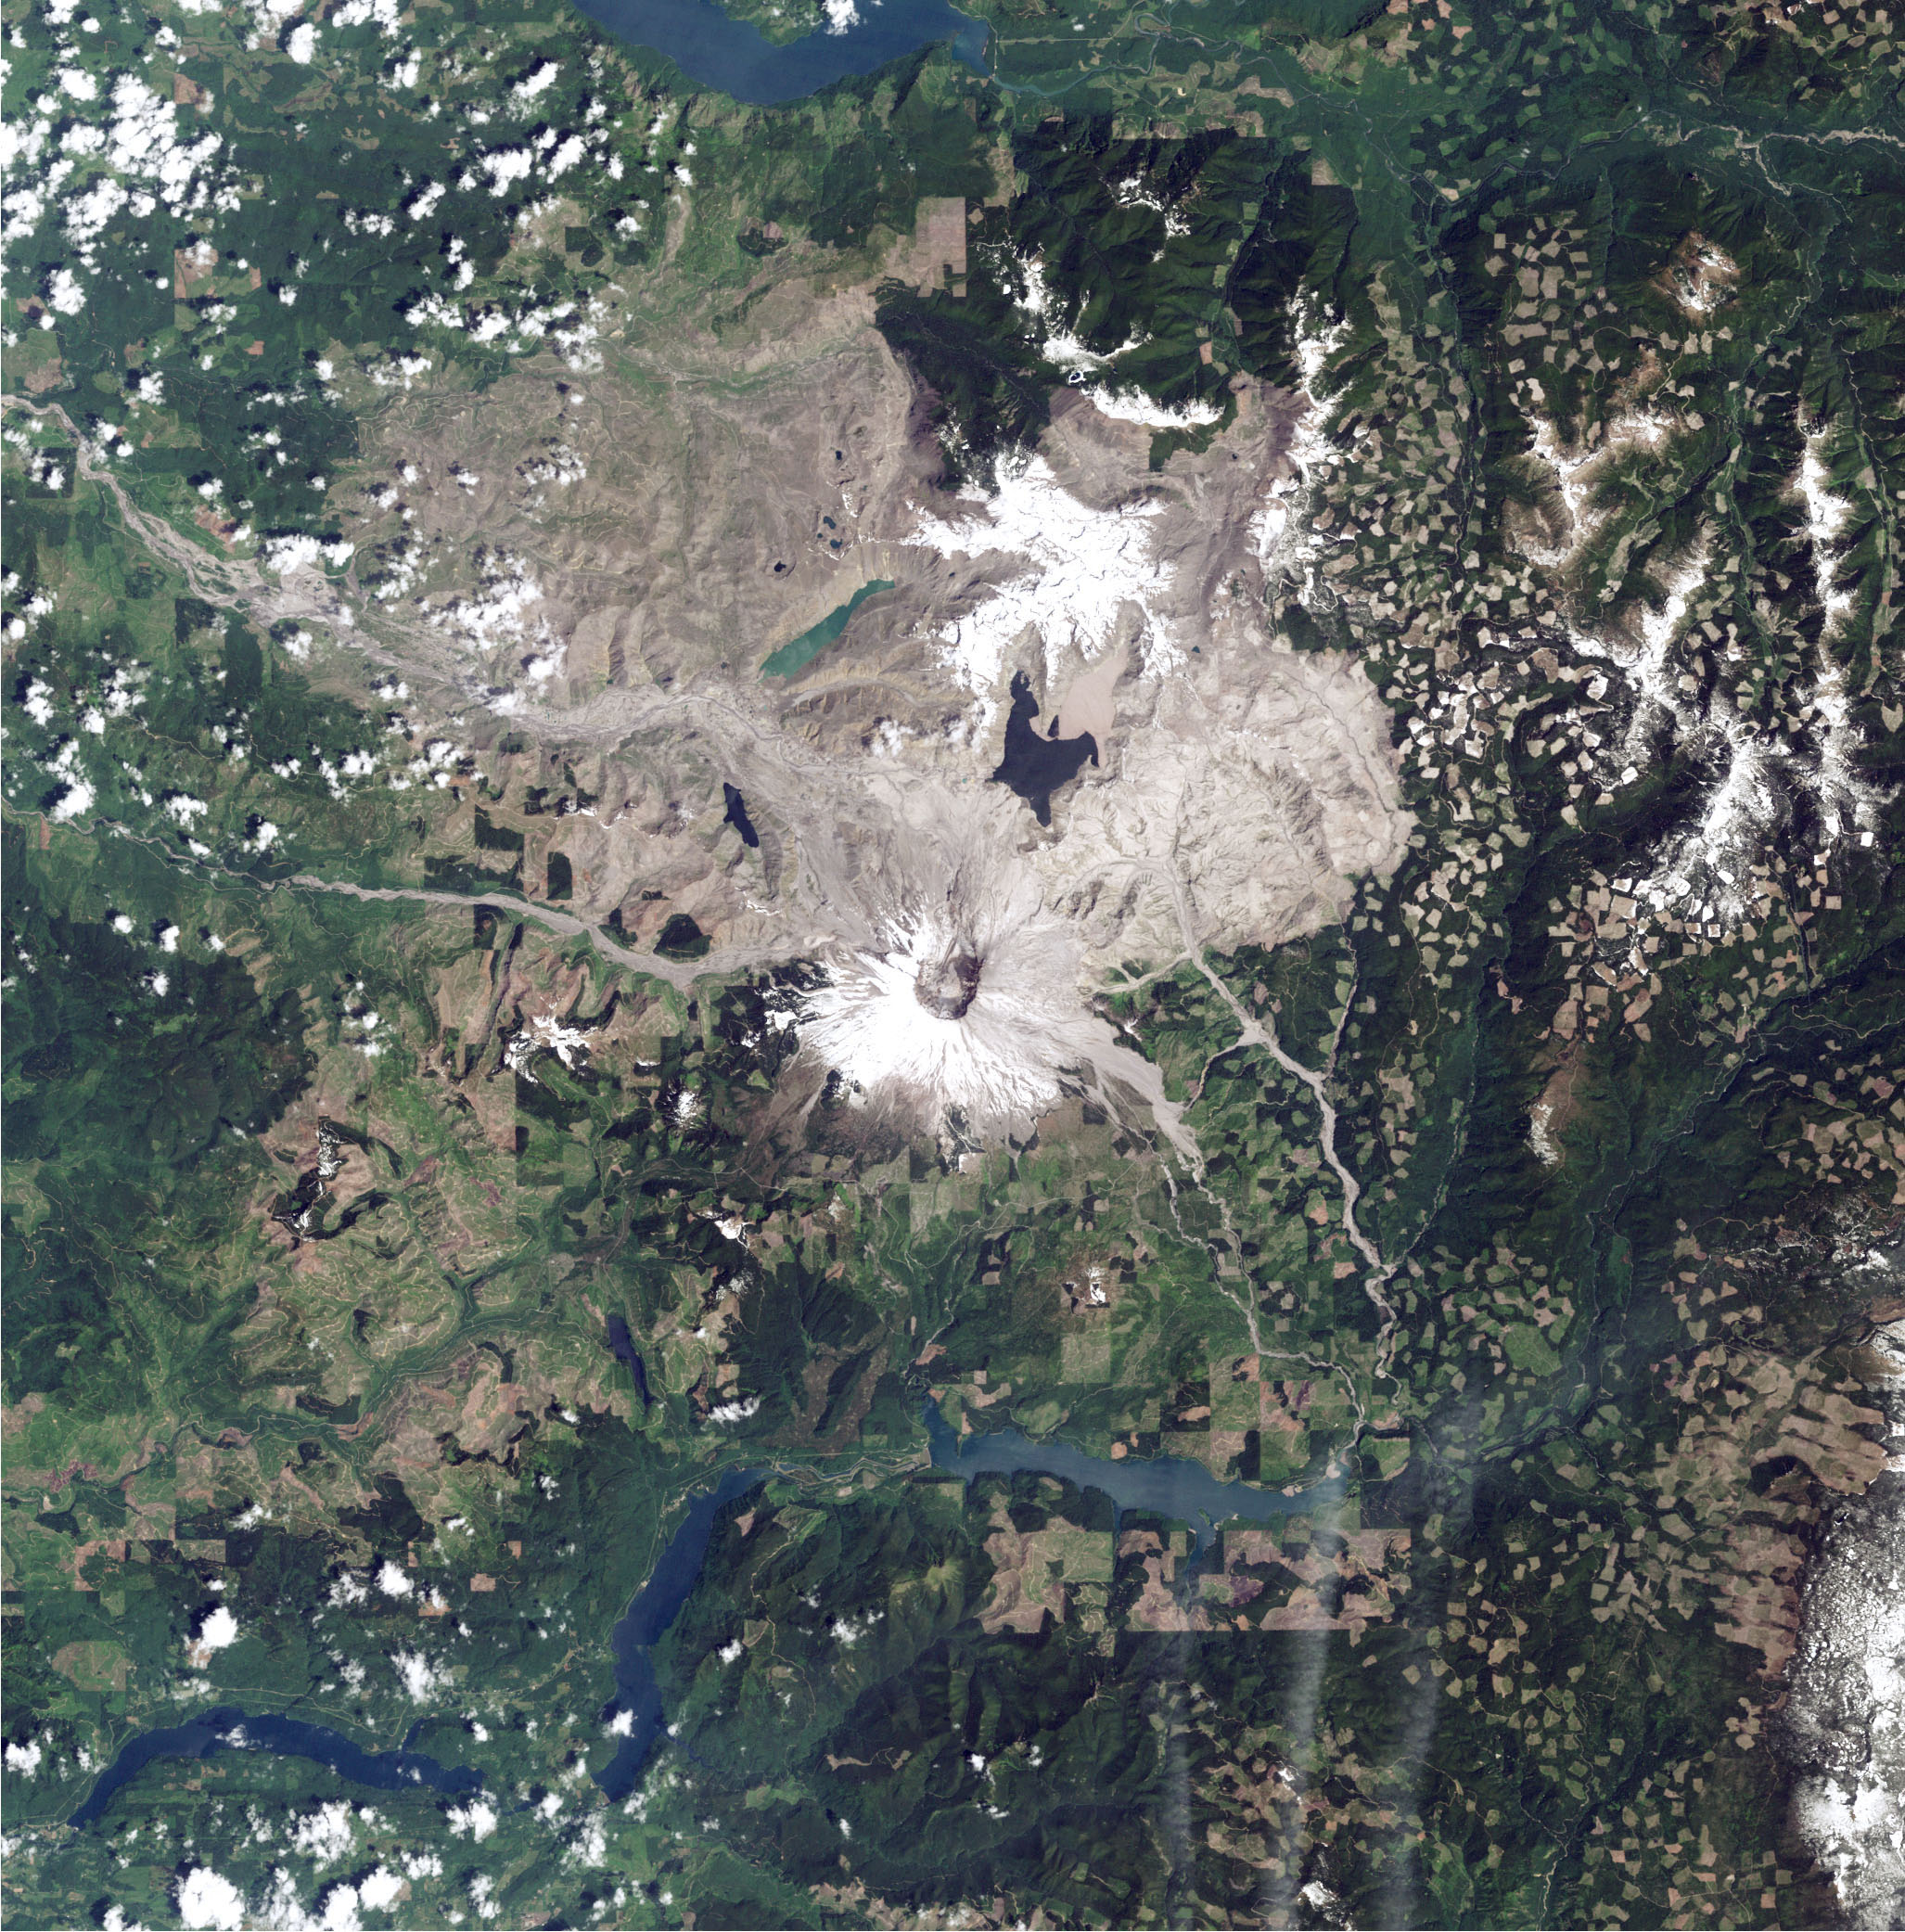
Forty years have passed since a tremendous blast at Mount St. Helens—the deadliest eruption in U.S. history—transformed the landscape for hundreds of square miles in the Pacific Northwest. Satellite images acquired in the days around the eruption on May 18, 1980, helped scientists understand the event; images acquired over the past four decades have given them insight into how a landscape recovers.
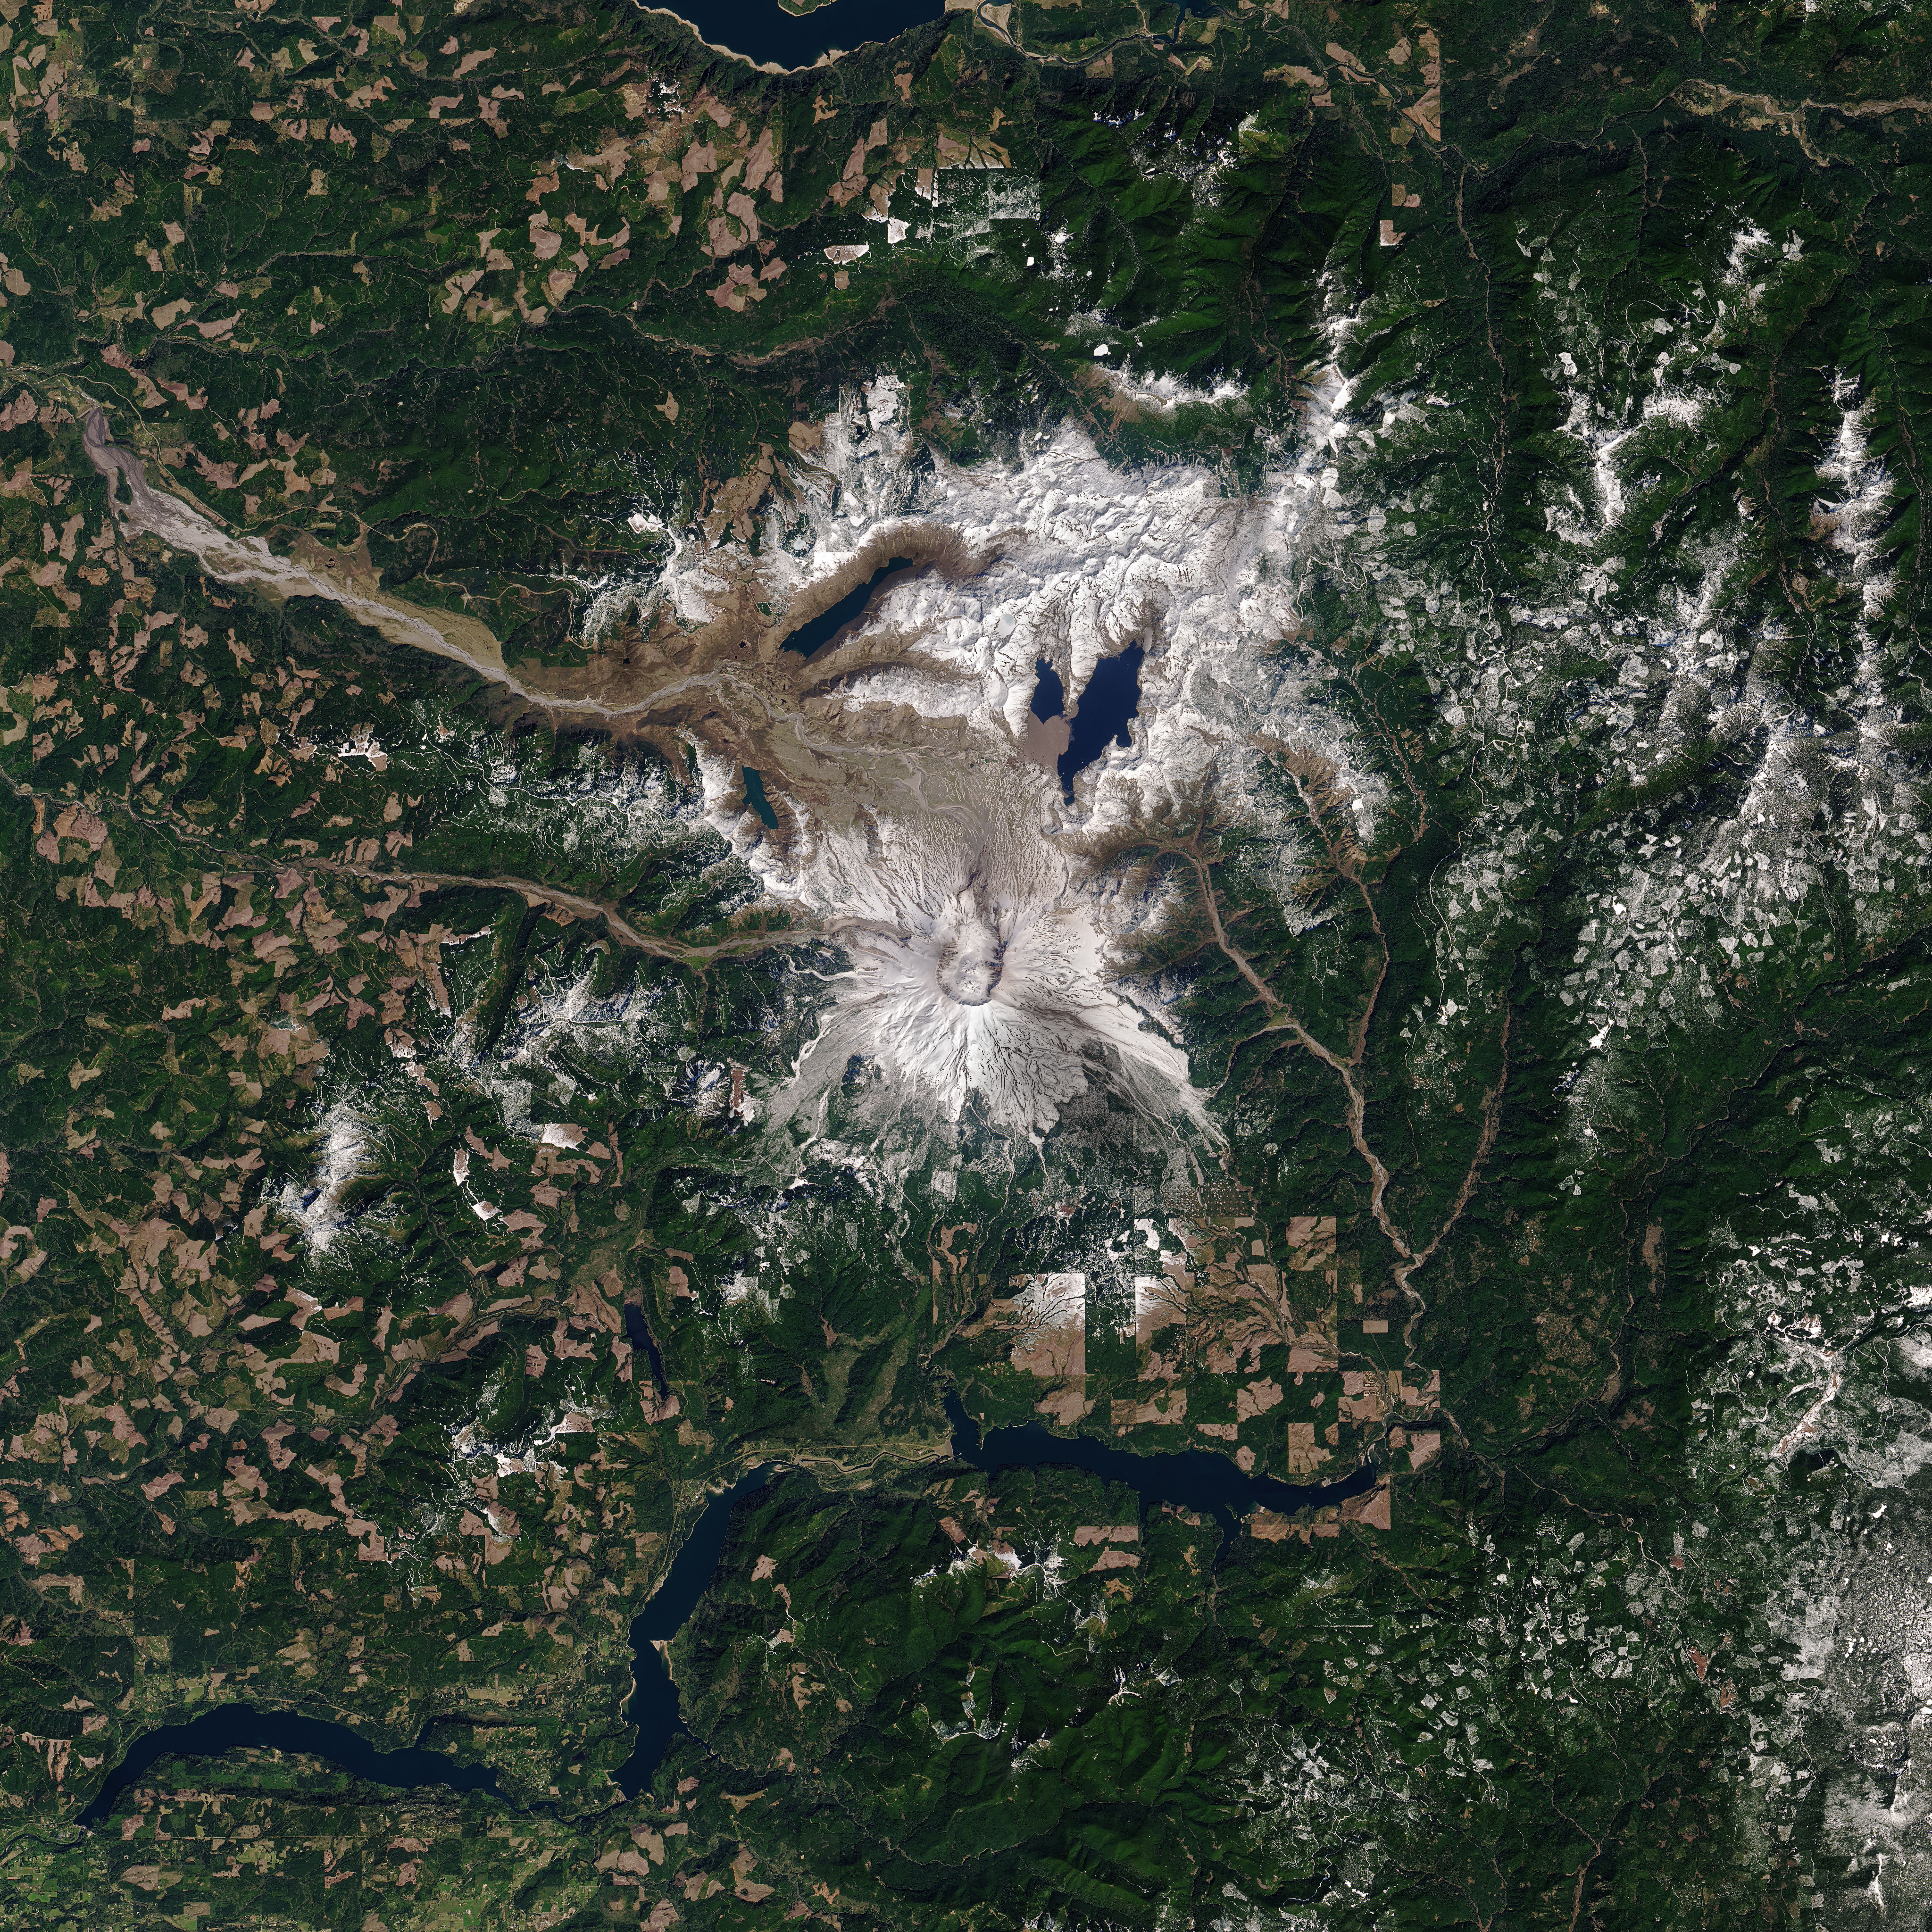
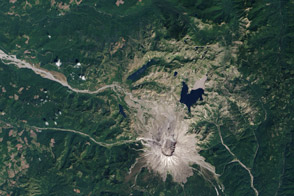
The image above, acquired with the Operational Land Imager (OLI) on Landsat 8, shows the volcano in southwest Washington on April 17, 2020. Seasonal snow still blanketed its flanks despite the spring sunshine. By August, most of the snow on the mountain will melt. The image is the most recent, cloud-free view of the mountain from Landsat 8, which acquires images of any given place on Earth about once every two weeks.
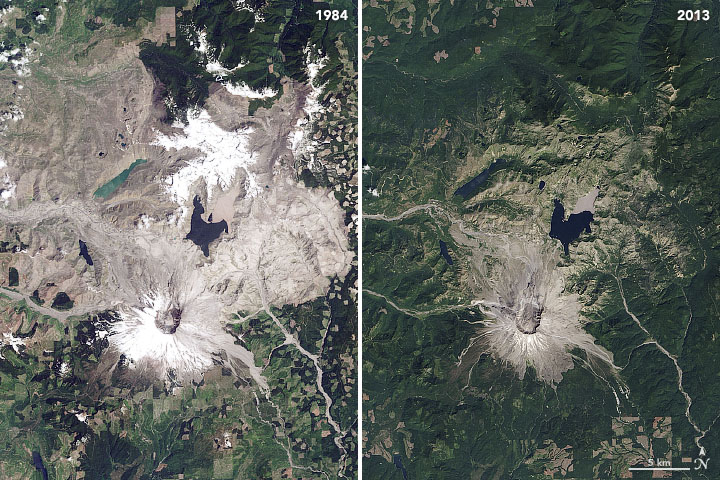
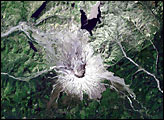
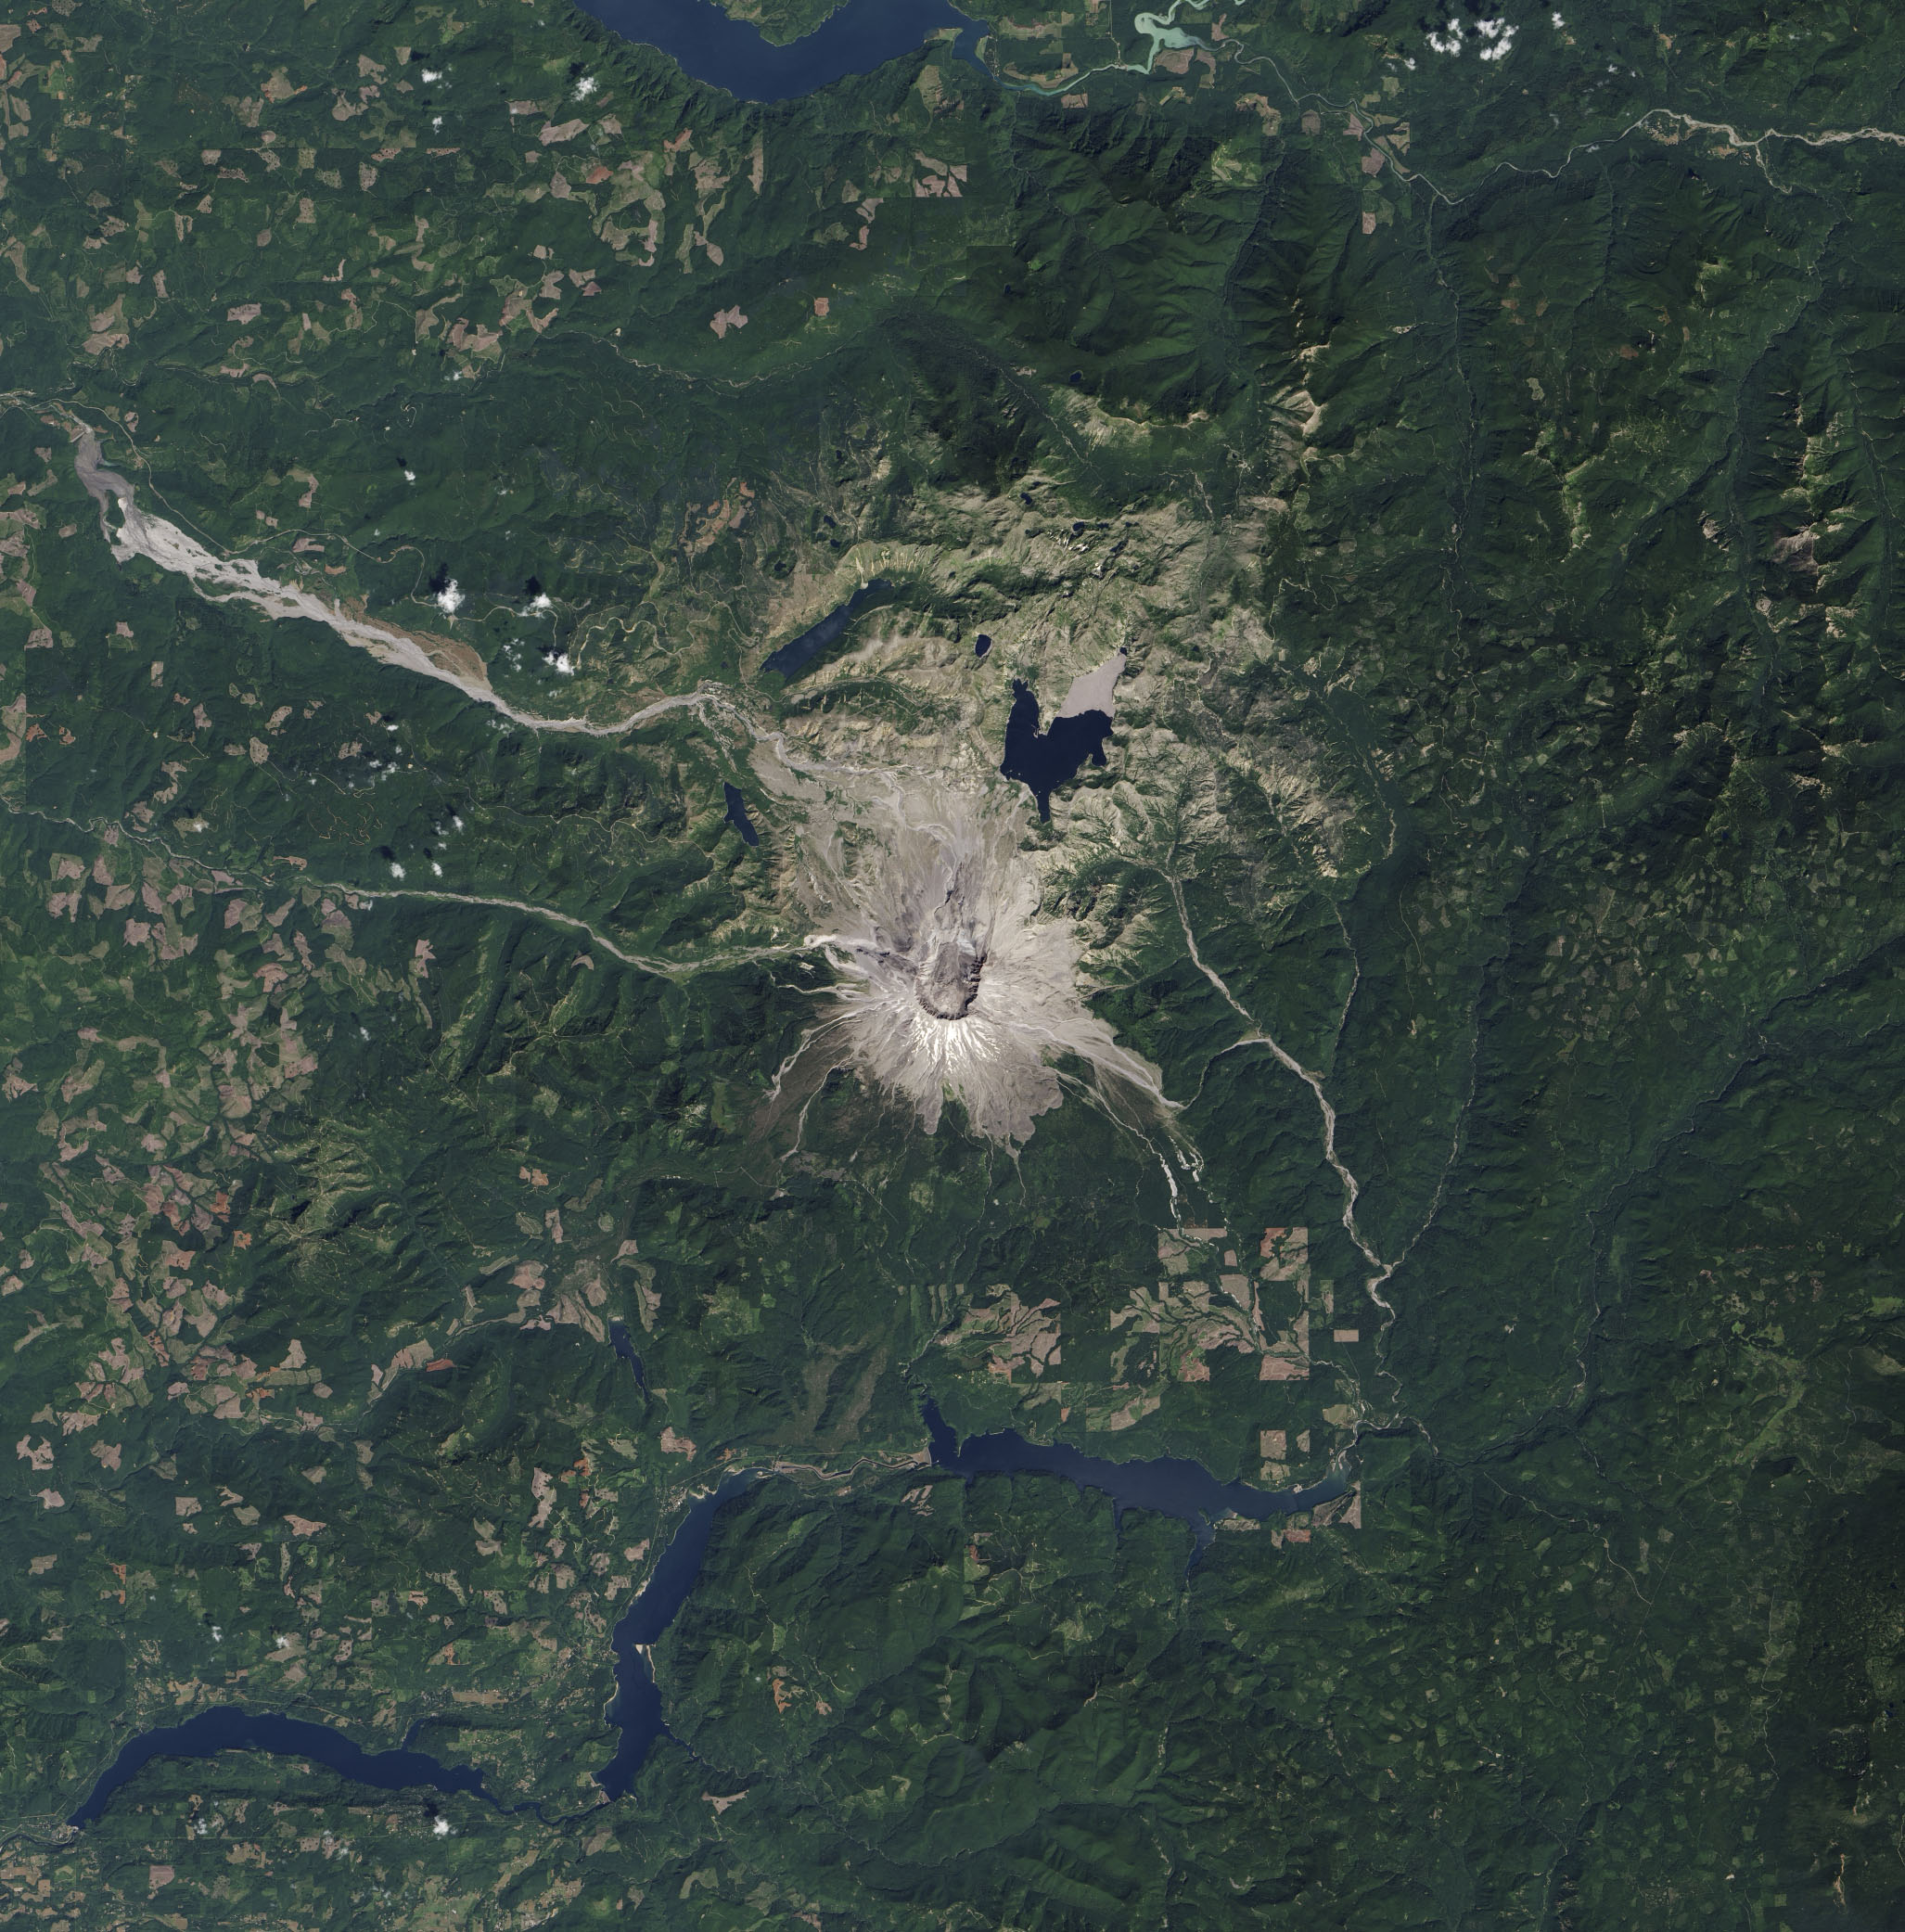
Landsat satellites have been acquiring images of Mount St. Helens for nearly five decades. The image pair above is from our World of Change series, which shows the scale of the eruption and the process of recovery. View the full series to watch green plants and trees reclaim the land on the far outskirts of the volcano in the late 1980s and then closer to the mountain by the late 1990s. Change is still ongoing—plants are growing on the once sterile Pumice Plain north of the crater—but the changes can be slow and now appear less dramatic in annual images.
“I think these long-time series will be useful for decades to come, possibly out to a century after the eruption, as change is very slow,” said Steve Self, a professor at the University of California Berkeley.
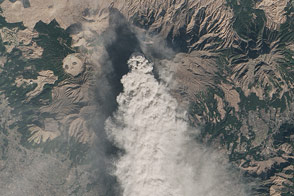
Here's the visible satellite loop of the Pacific Northwest 37 years ago today - as Mount St. Helens erupted. #wawx pic.twitter.com/K2t1gUi9Ho
— NWS Seattle (@NWSSeattle) May 18, 2017
The Geostationary Operational Environmental Satellite-3 (GOES-3) captured black and white images of the eruption as it happened forty years ago. Unlike Landsat satellites, which follow a predetermined ground track to collect imagery from around the entire planet, GOES satellites provide a constant view of the same area. This “geostationary” orbit is most valuable for weather monitoring. In this case, it was useful for watching an eruption unfold.
The animation above, shared in 2017 by the National Weather Service in Seattle, shows a series of GOES-3 images acquired on May 18, 1980. GOES-3 was operated by the National Oceanic and Atmospheric Administration (NOAA); NASA helps develop and launch the GOES series of satellites.
The GOES-3 images from that day were also analyzed in research papers published by Self and colleague Rick Holasek. “The Mount St. Helens eruption was possibly the was the first time I saw satellite images from an eruption,” Self said. “I was very interested in these images because they gave a huge overview, and Rick and I had NASA support to explore this “new” technology. That—and the exciting observations we could make—led to our series of papers on the Mount St. Helens eruption clouds.”
Self noted the impressive density of the initial blast cloud, visible in the first three images of the animation, compared to that of the later phases, which sent pumice and ash flying as far as Idaho. The blast cloud rose quickly, reaching about 30 kilometers altitude in just four minutes.
Decades later, instruments on weather and research satellites are a routine but vital component of observing eruptions and their plumes. Scientists map the gases and particles in volcanic emissions to find out how they affect the air and climate. They also contribute to volcanic ash advisory centers in their predictions of the movement of volcanic clouds and, if necessary, the rerouting of aircraft.
NASA Earth Observatory images by Joshua Stevens, Robert Simmon, and Jesse Allen, using Landsat data from the U.S. Geological Survey. Story by Kathryn Hansen.


