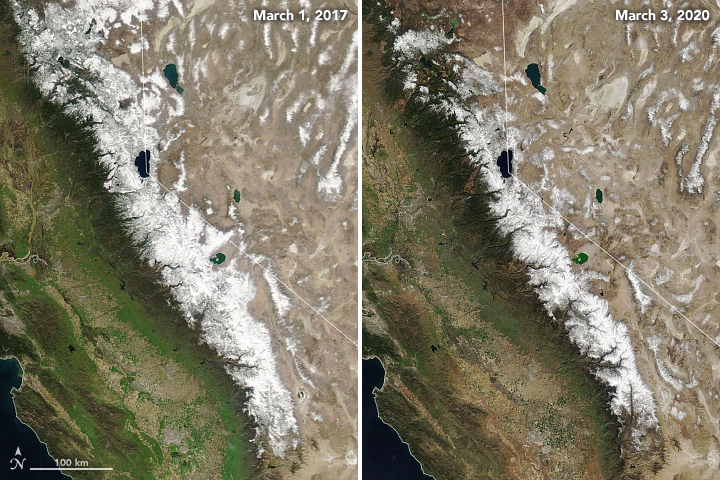
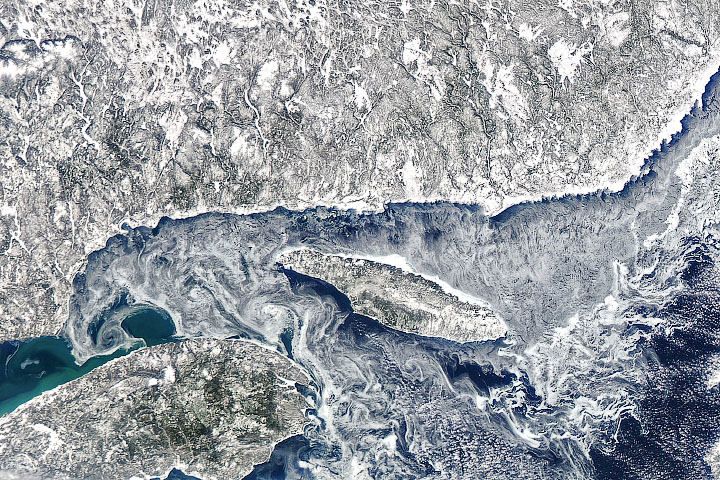
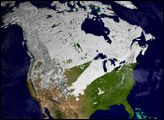
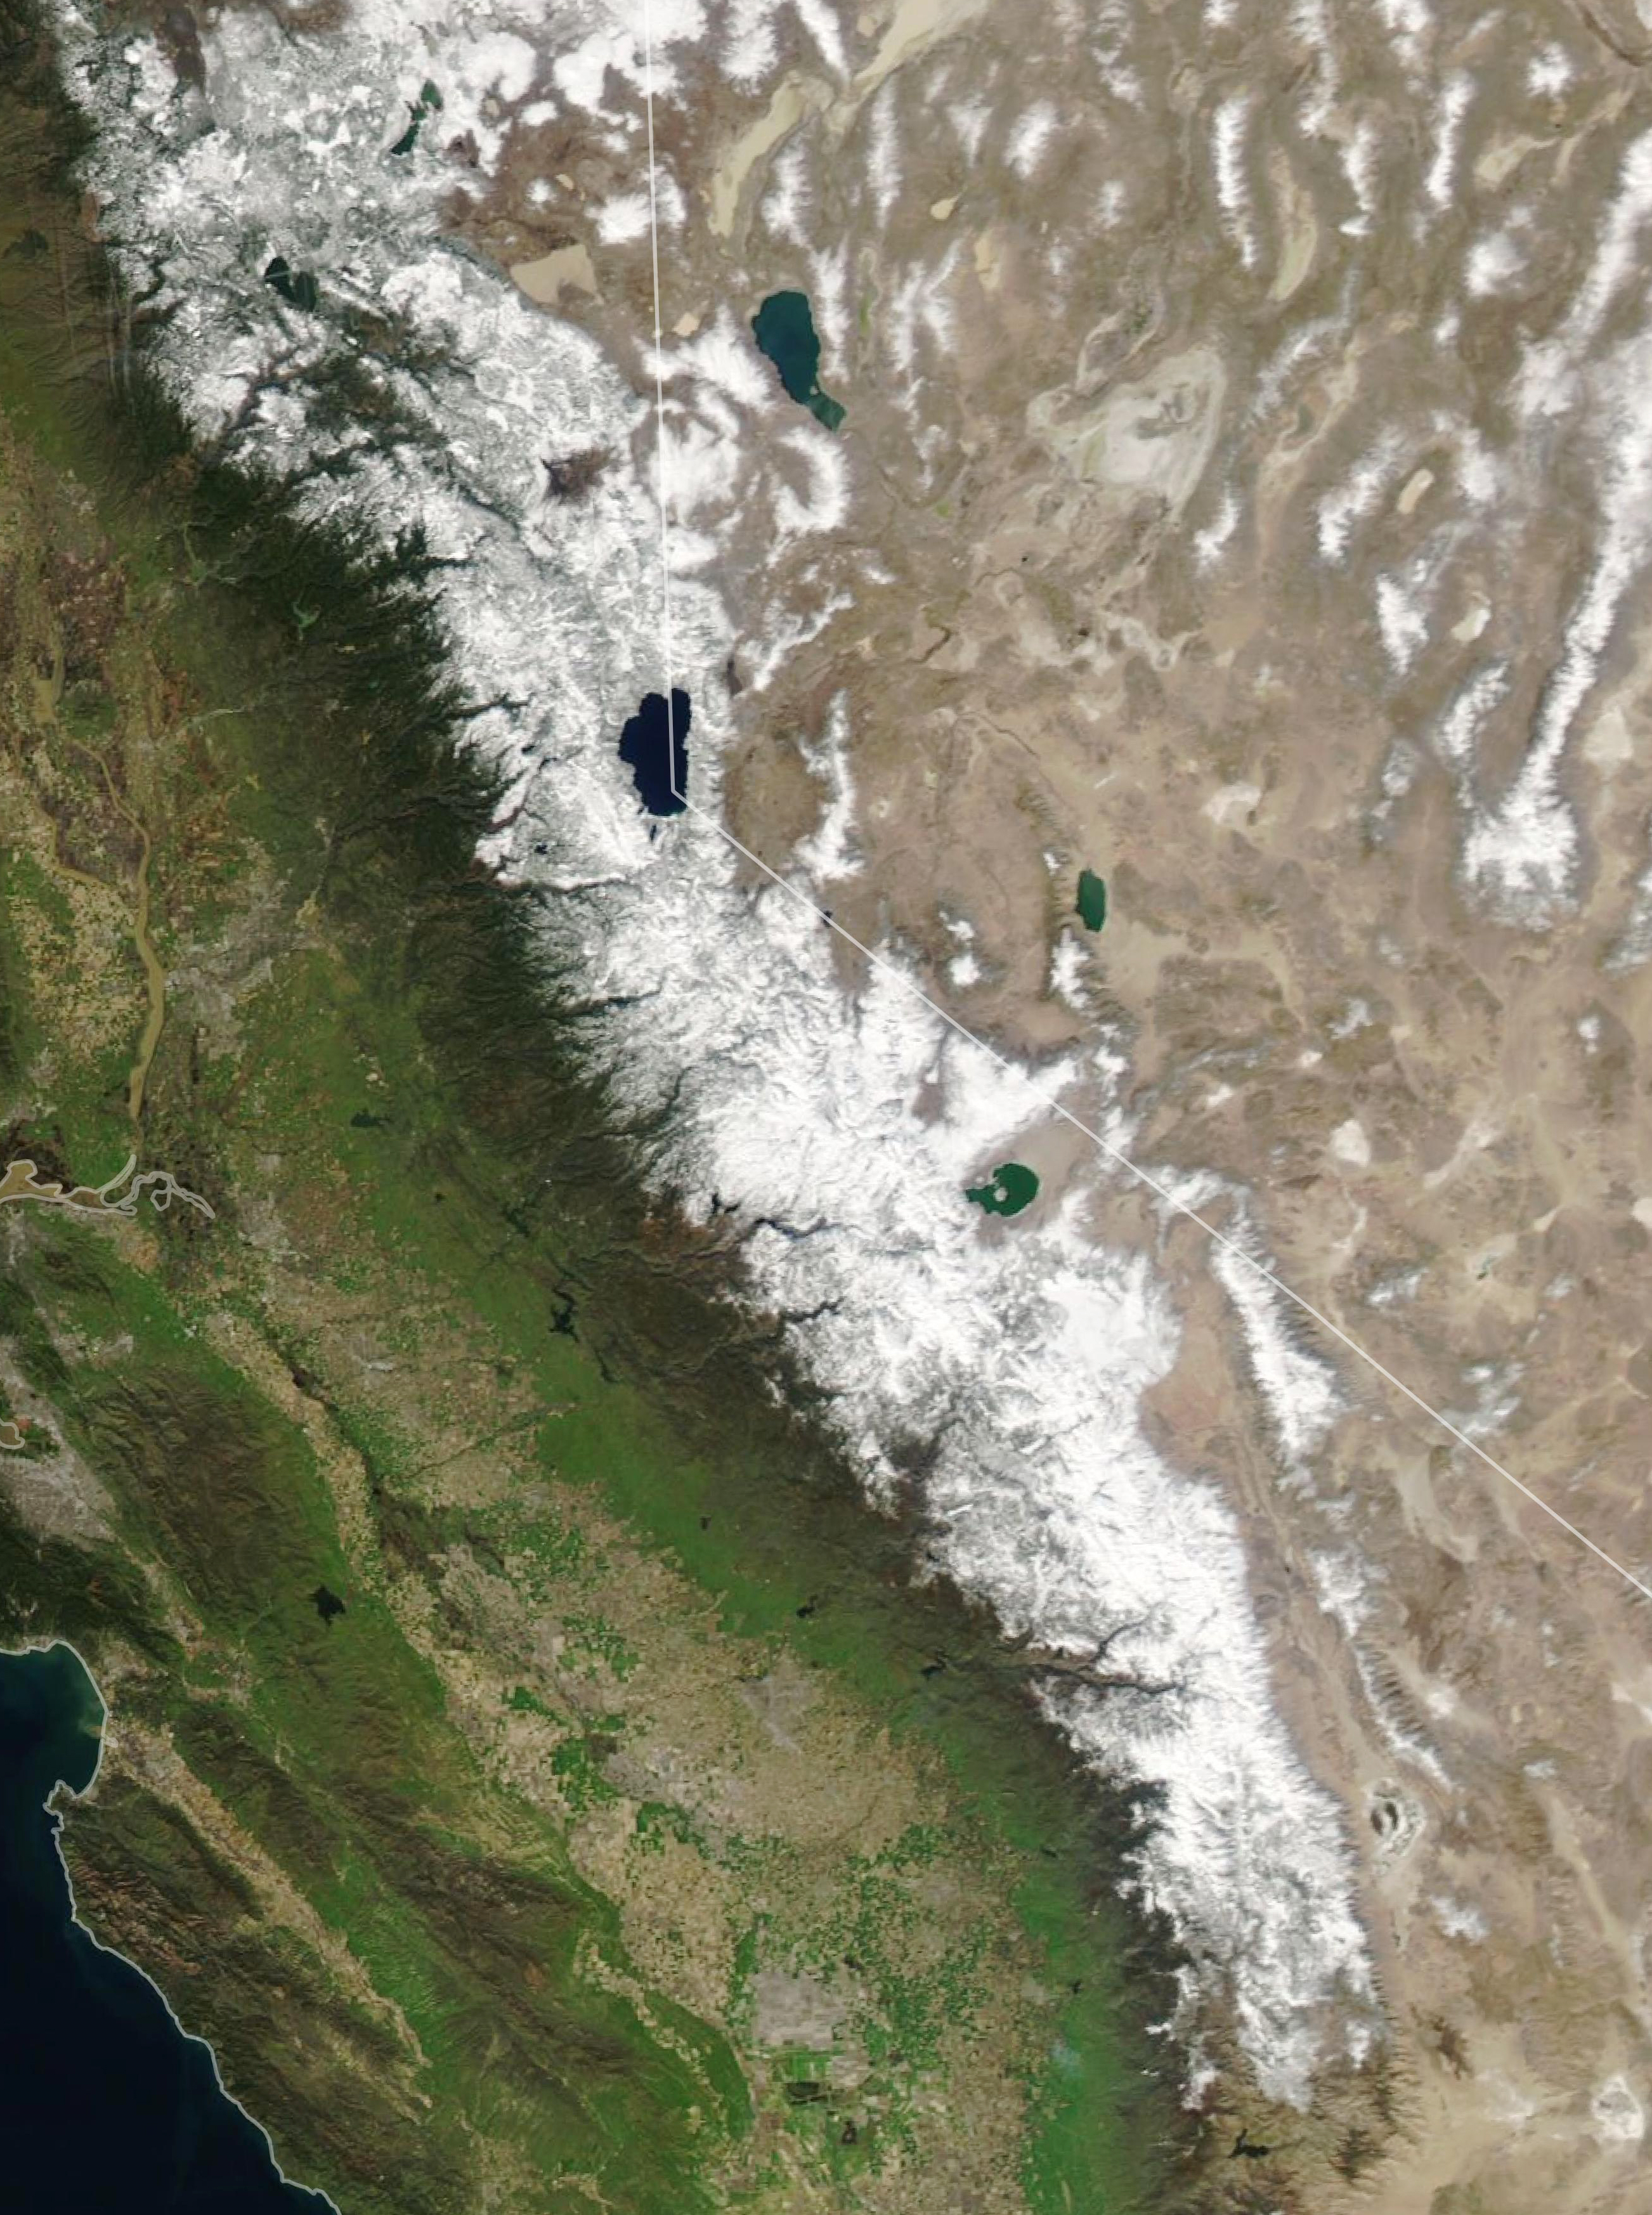
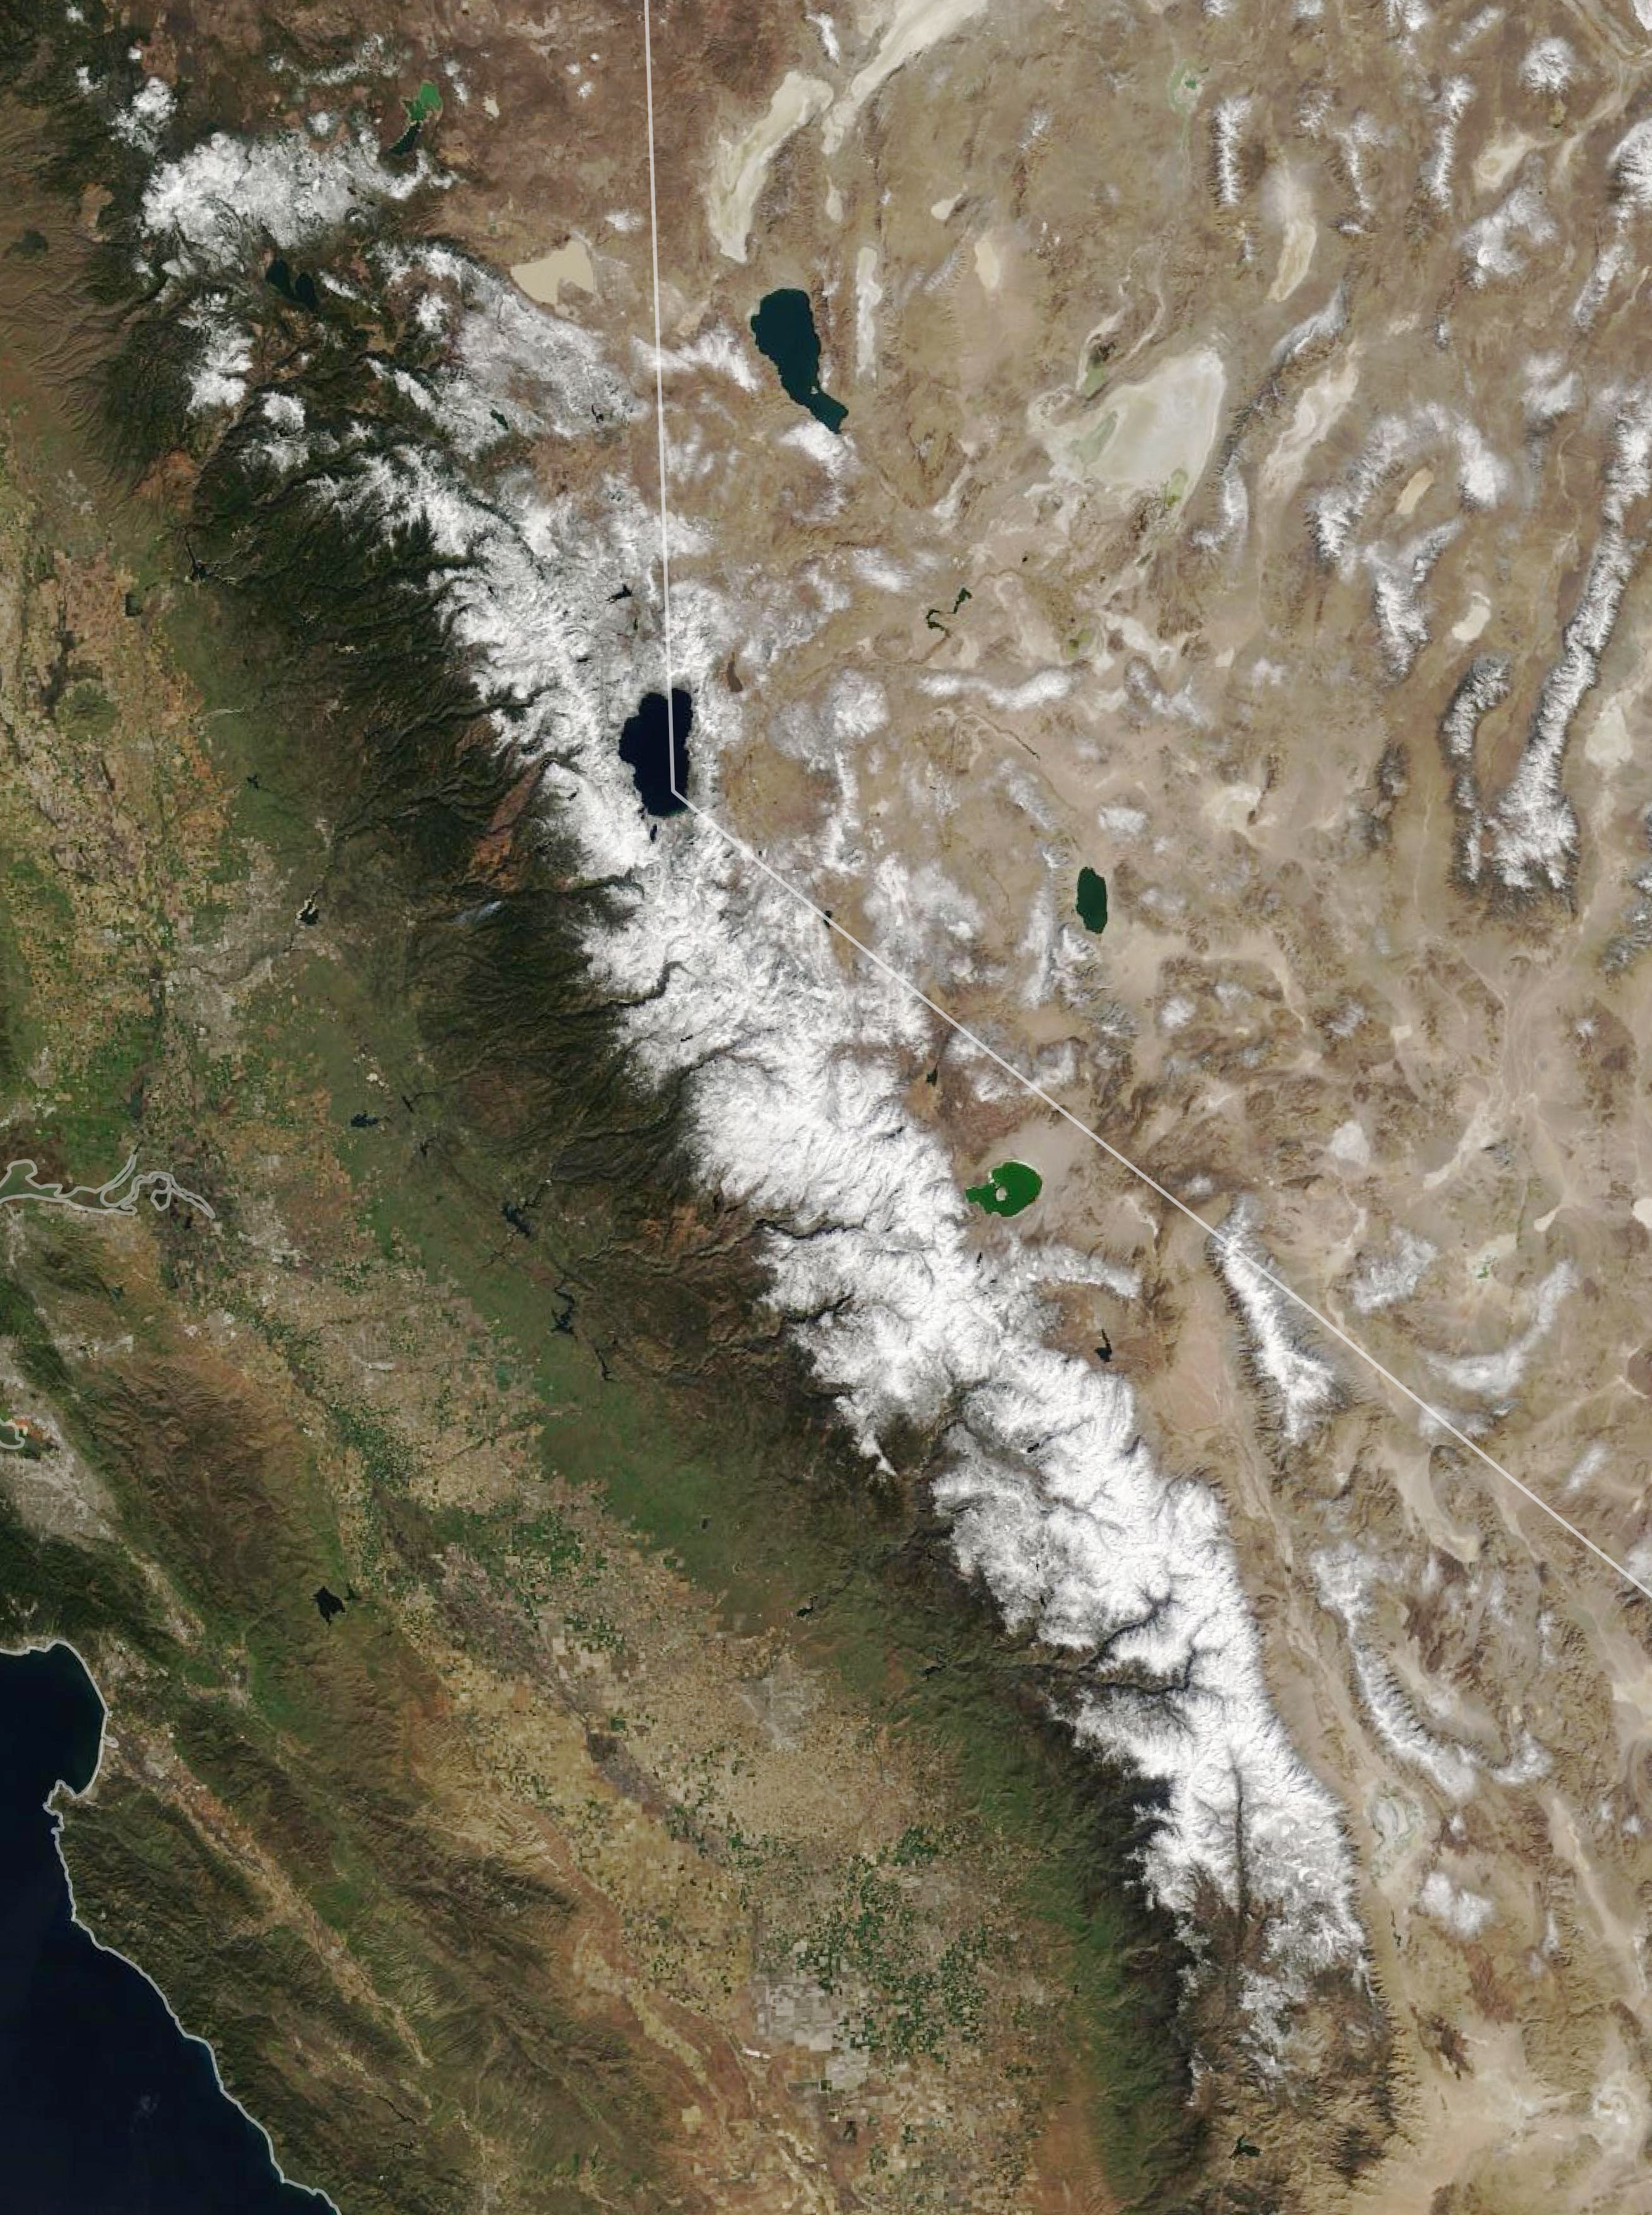
The winter of 2019-2020 brought a range of extreme weather to the mid-latitudes of the Northern Hemisphere, with some areas receiving a deluge of moisture and others staying much drier than usual. California experienced the latter, as evidenced by the thin snowpack in the Sierra Nevada near the start of spring.
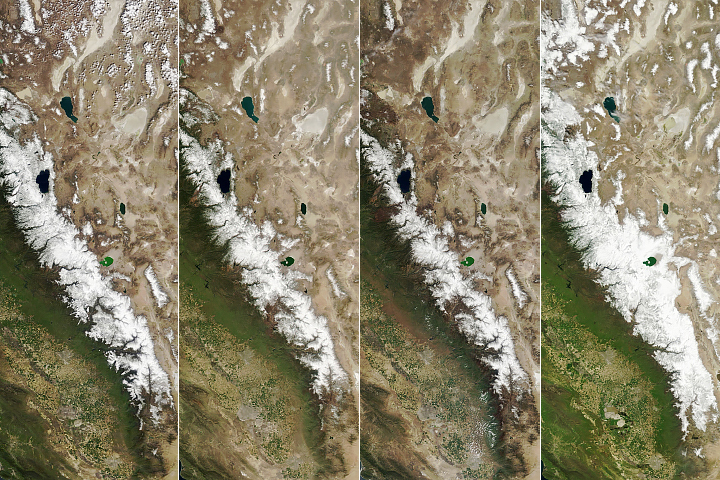
The natural-color satellite images above, acquired by the Moderate Resolution Imaging Spectroradiometer (MODIS) instruments on NASA’s Terra and Aqua satellites, show the area covered by snow in March 2020 compared to March 2017 (a record high year).
Snow-covered areas make for an interesting visual, but such imagery does not tell a complete story because it does not account for the depth or density of the snow. A more meaningful indicator of the quality of the snowpack is snow-water equivalent—an estimate of how much water you would get if all of the snow melted at once.
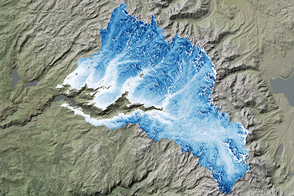
The maps below show snow-water equivalents across the Sierra Nevada in early March for each year between 2015 and 2020. Data for the maps, developed by the University of Colorado’s Center for Water, Earth Science, and Technology, are derived from ground-based data, computer models, and satellite imagery. They incorporate a data set from the Jet Propulsion Laboratory (JPL) called the MODIS Snow Covered Area and Grain-size (MODSCAG), which uses data from NASA’s Terra satellite to determine properties of the snow—things like the area covered, grain size, and albedo—that are useful for deriving accurate estimates of snow-water equivalent.
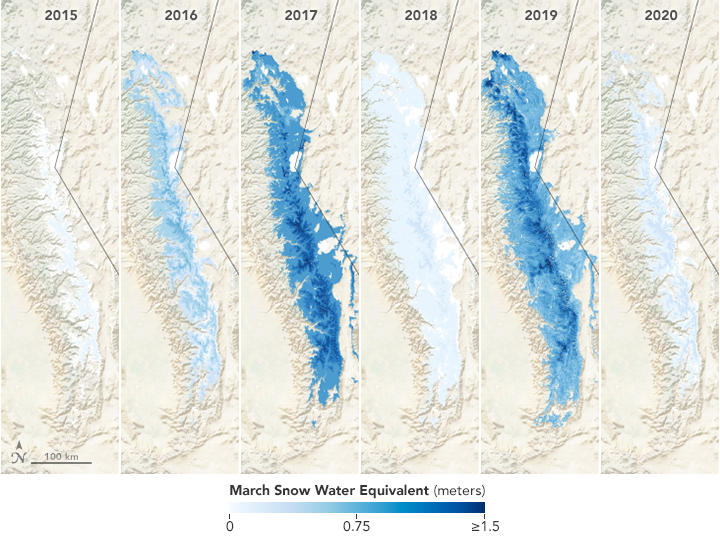
Snowpack in the Sierra Nevada in 2020 is compared to the lowest snow year on record (2015), an average snow year (2016), and one of the most abundant (2017). Snow-water equivalent in 2020 was not record-breaking, but still measured just 37 percent of the five-year mean.
“In the high snowpack year of 2017, we received snowfall from several large atmospheric rivers,” said Kat Bormann, project scientist for the Airborne Snow Observatory mission based at JPL. “As of early March this year, we have not seen any such events.” Surges of moist air from the tropical Pacific can deliver significant amounts of precipitation to the West Coast of the United States.
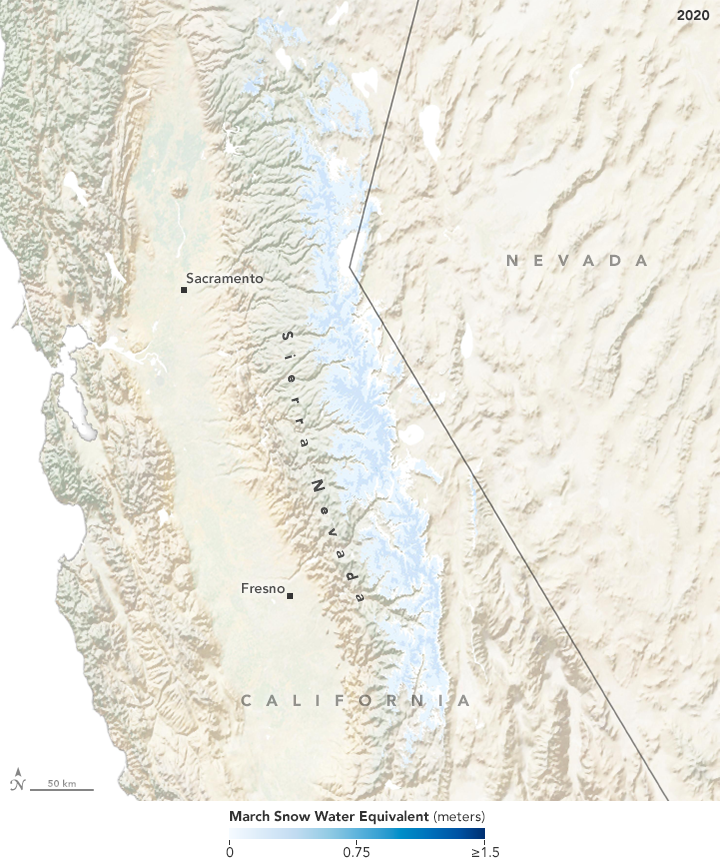
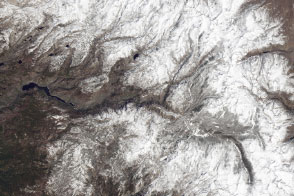
The large map for March 2020 highlights how snow cover can be patchy, which is often the case at low elevations in low snow years. On March 3, snow-water equivalent was low or nonexistent below elevations of 2,000 meters (7,000 feet), which is unusual for this time of year. There were also regional variations in snow-water equivalent, with the northern Sierra Nevada holding just 36 percent of the 2000-2011 average. The central part of the range had 38 percent of average, and the southern part had 30 percent.
There is still time for the snowpack to improve. Snow-water equivalent usually reaches its annual maximum around the beginning of April. But Bormann notes that significant improvement would require several atmospheric rivers to show up. These weather patterns typically bring about half of California’s precipitation in a year.
While snowpack is low, several reservoirs across California have stayed relatively full thanks to good snowfall in 2019. As of March 10, 2020, Lake Shasta stood at 78 percent of water storage capacity (which is 103 percent of the historical average for that date); the Don Pedro Reservoir was at 80 percent (112 percent of average); and Castaic Lake was also at 80 percent (91 percent of average).
According to Bormann, low snow years pose problems for the replenishment of groundwater—an important water source for farmers in California’s Central Valley. Less snow means less meltwater running down into a groundwater system that is already depleted. Also, water managers could be less inclined to release surface waters from rivers, lakes, and reservoirs for irrigation if there is not enough snowpack to replenish it.
More details about the 2019-2020 snow season will become evident when the Airborne Snow Observatory resumes flights over the mountain range around April 1. The annual airborne mission uses imaging spectrometers and lidar instruments to collect measurements of snow depth and snow-water equivalents that help inform MODSCAG and other models of conditions across the range.
NASA Earth Observatory images by Lauren Dauphin, using MODIS data from NASA EOSDIS/LANCE and GIBS/Worldview. Snow-water equivalent data courtesy of Noah Molotch (PI), Leanne Lestak (map development), Keith Musselman (collaborator), and Kehan Yang (model developer) / University of Colorado, Center for Water, Earth Science and Technology. Story by Kathryn Hansen with map interpretation by Kat Bormann / NASA JPL.


