Ice roads are well known for being one of the most dangerous throughways a trucker might encounter, and a recent study in Nature indicates that the window of time when they can be built and used safely is shrinking.
Many remote communities, mines, oilfields, and research outposts in the coldest parts of the world rely on ice roads over rivers in the winter. They are an economical alternative to other forms of transportation in seasons when boats cannot operate and in areas where bogs or other obstacles make year-round roads and runways impractical.
In an assessment of the world’s river ice, researchers from the University of North Carolina at Chapel Hill (UNC) and Texas A&M University analyzed more than 400,000 Landsat images collected between 1984 and 2018, using Google Earth Engine to track when each river had ice. They found that the maximum extent of river ice occurred in March. In that month, 56 percent of the river length observed by satellites was ice-covered on average. In April, maximum ice extent dropped to 47 percent. In May, it dropped to 22 percent.
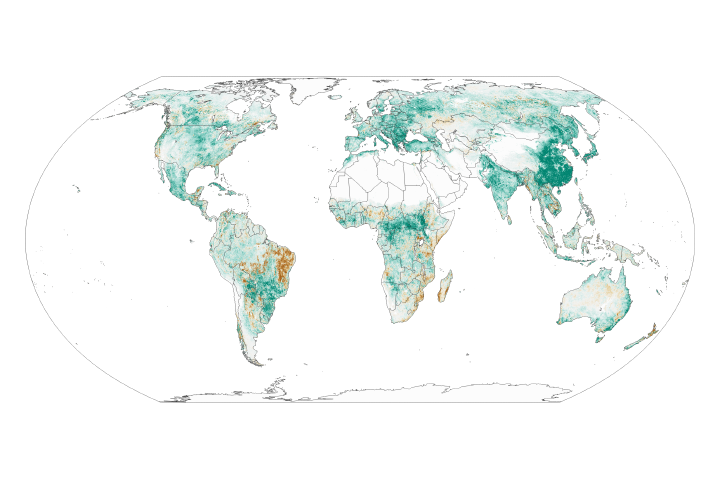
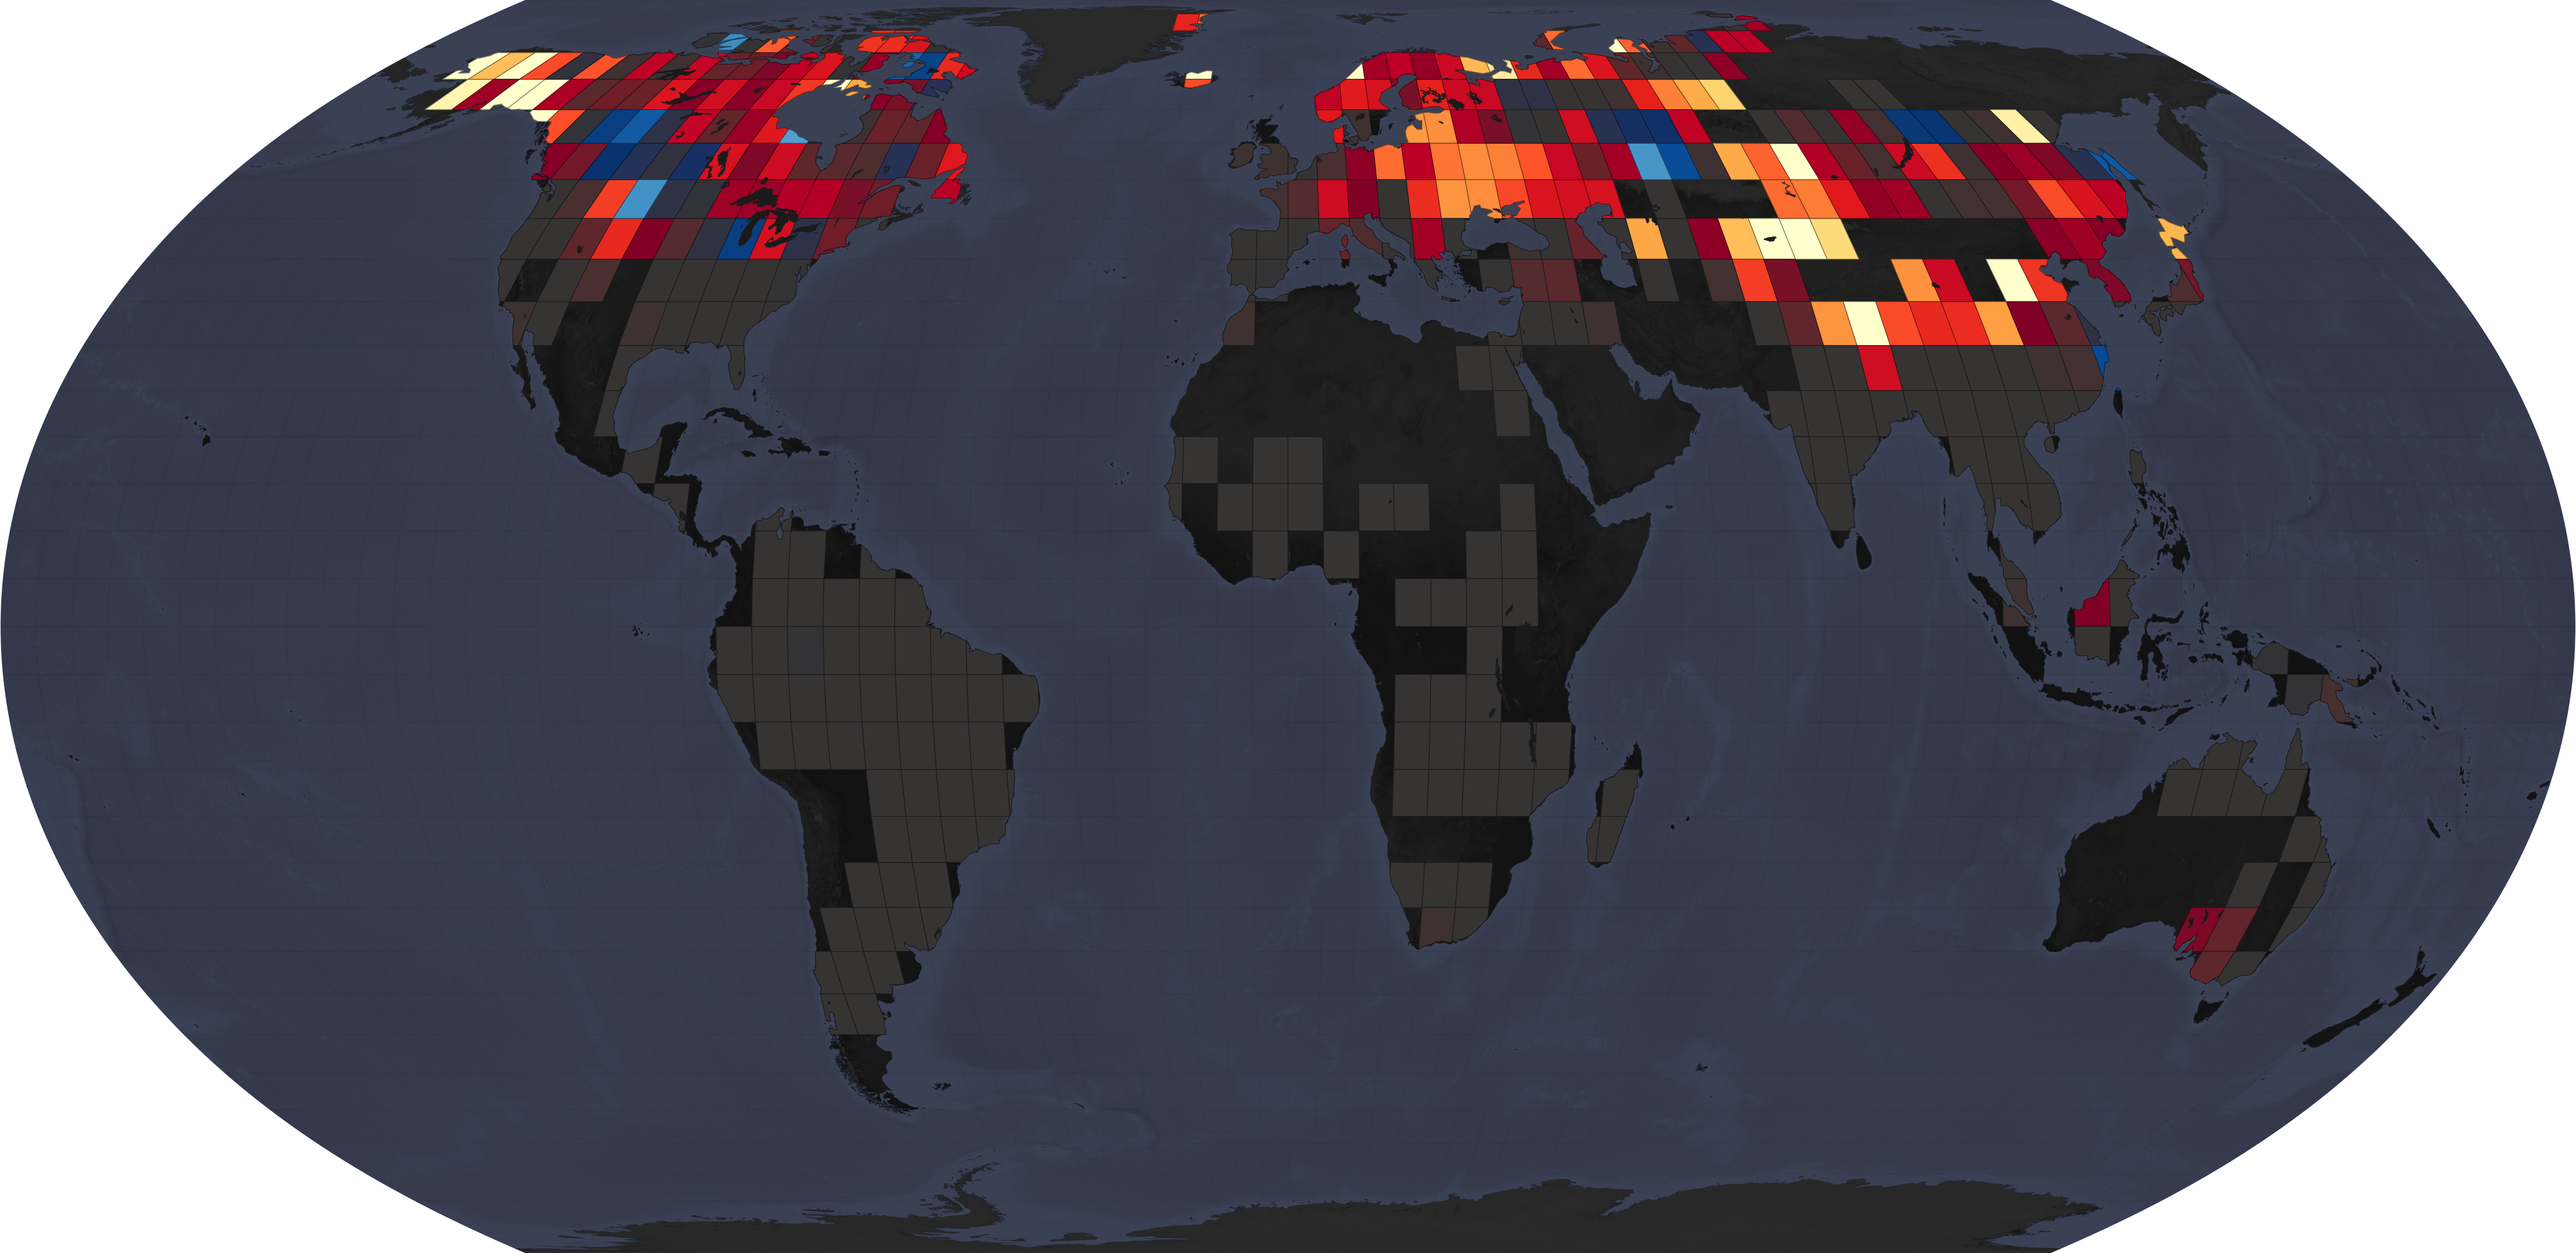
The map above shows the mean river ice extent in northern hemisphere winter (December, January, and February) and southern hemisphere winter (June, July, and August). The vast majority of ice-covered rivers are found in the Northern Hemisphere; just a few rivers were found with seasonal ice south of the equator (in New Zealand, Patagonia, and Australia). Note, however, that the analysis only included rivers wider than 90 meters (300 feet). Smaller rivers and creeks certainly freeze, but Landsat cannot resolve them well enough to reliably distinguish between water, ice, and land.
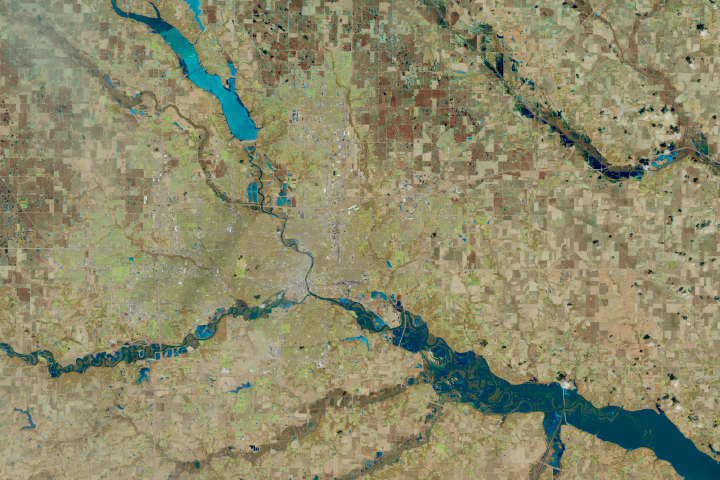
The map below depicts the changes in river ice conditions between1984-1994 and 2008-2018. It shows change in percentage points, which is different than a percentage change. Moving from 10 percent ice cover to 7.5 percent ice cover would be a 2.5 percentage point change, but a 25 percent change.
Looking across three decades, the researchers found an average global monthly decline in river ice extent of 2.5 percentage points. In March, when the starkest changes occurred, there was a 4.3 percentage point decline. The greatest declines occurred in the Tibetan Plateau, eastern Europe, and Alaska, noted Xiao Yang, a hydrologist at UNC.
The scientists also developed a model that projects how river ice might respond if air temperatures continue to increase. The researchers found that for every 1° Celsius (1.8° Fahrenheit) increase in global temperatures, there would be about six fewer days of river ice per year. Scientists and policymakers currently project somewhere between a 2.5°C and 4.8°C increase (4.5°F and 8.6°F) in global temperatures by 2100, depending on how aggressively countries limit their greenhouse gas emissions.
“Changes like this might seem small, but they can have major consequences for communities in the far north, which already have a limited window of time to construct and safely use ice roads each year,” said Tamlin M. Pavelsky, a hydrologist at UNC and one of the study’s authors.
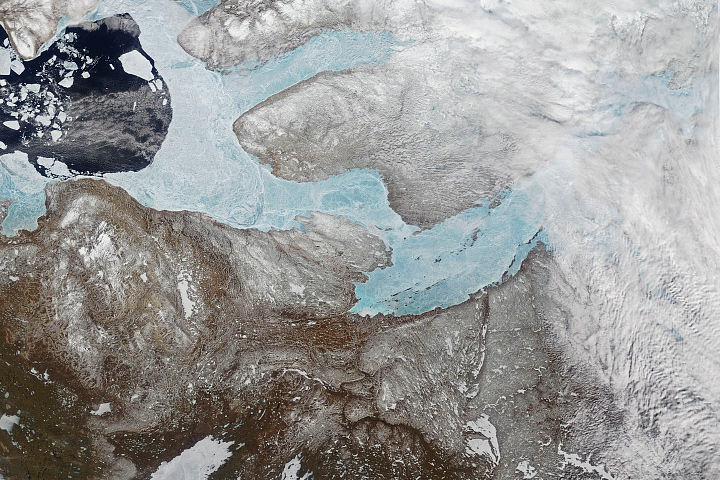
The natural-color image at the top of this page shows ice breaking up in the Lena River Delta on June 11, 2015. The image was acquired by the Operational Land Imager (OLI) on Landsat 8. Some of the ponds appear green because they have a layer of melt water over a lower layer of ice.
“It is worth noting how critical Google Earth Engine was for this project,” said Pavelsky. “Five years ago, we never would have thought that to analyze the entire Landsat record for something like this. It would have been incredibly time consuming—basically impossible.”
This study was part of a larger effort to prepare for the upcoming NASA/CNES Surface Water and Ocean Topography (SWOT) mission. Once launched, that satellite will use radar interferometry to survey the world’s water surfaces. In order to process SWOT data, the team will need to have a good understanding of when and where rivers are ice covered.
NASA Earth Observatory images by Joshua Stevens, using data from Yang, X., et al. (2020), and Landsat data from the U.S. Geological Survey. Story by Adam Voiland.