The Earth Observatory has published its last Image of the Day on this website. Please join us on our new home at science.nasa.gov/earth/earth-observatory.
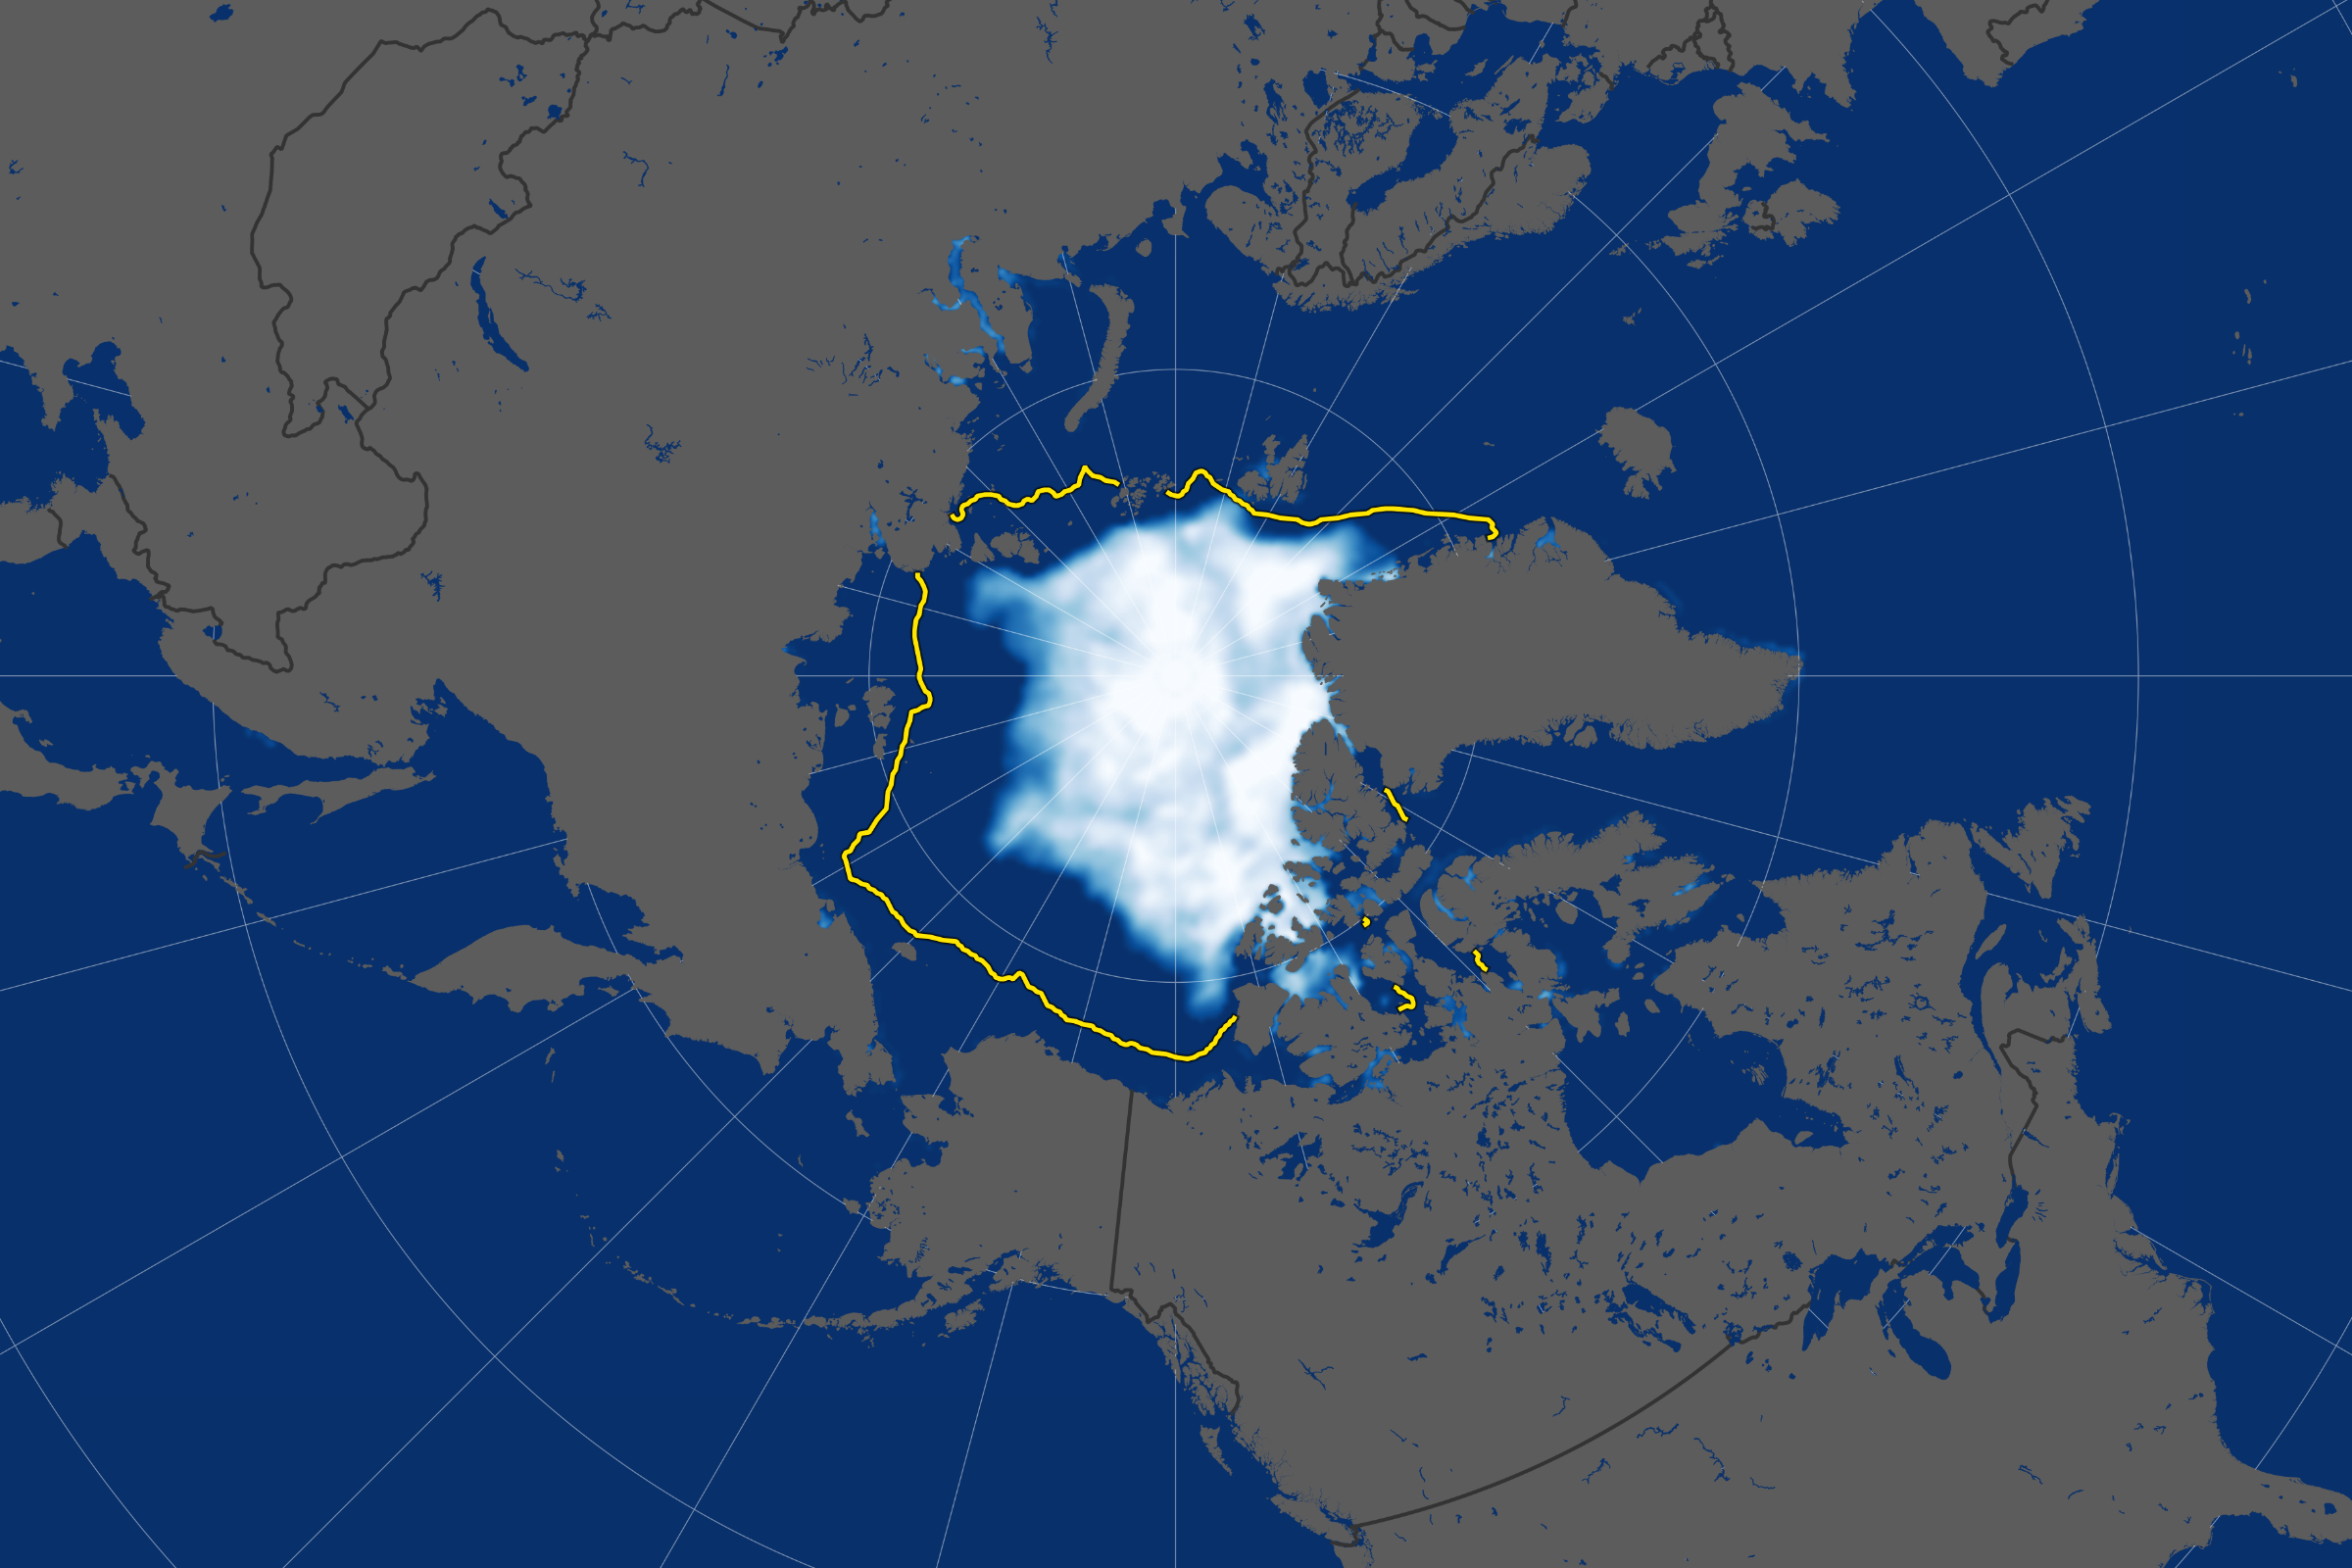
Arctic sea ice reached its annual summer minimum on September 18, 2019, according to NASA and the National Snow and Ice Data Center (NSIDC). Analysis of satellite data by NSIDC and NASA showed that the extent of ice cover this year effectively tied 2007 and 2016 as the second lowest in the satellite record, which dates back to late 1978. The sea ice cap shrank to 4.15 million square kilometers (1.60 million square miles) in 2019.
The Arctic sea ice cap is an expanse of frozen seawater floating on top of the Arctic Ocean and neighboring seas. Every year it expands and thickens during the fall and winter, then grows smaller and thinner during the spring and summer. But in recent decades, increasing air and water temperatures have caused marked decreases in Arctic sea ice extents in all seasons, with particularly rapid reductions in the summer ice extent.
Changes in Arctic sea ice cover have wide-ranging impacts. The sea ice affects local ecosystems, regional and global weather patterns, and the circulation of the oceans.
“This year’s minimum shows that there is no sign that the sea ice cover is rebounding,” said Claire Parkinson, a senior scientist at NASA’s Goddard Space Flight Center. “The long-term trend for the Arctic sea ice extent has been definitively downward.”
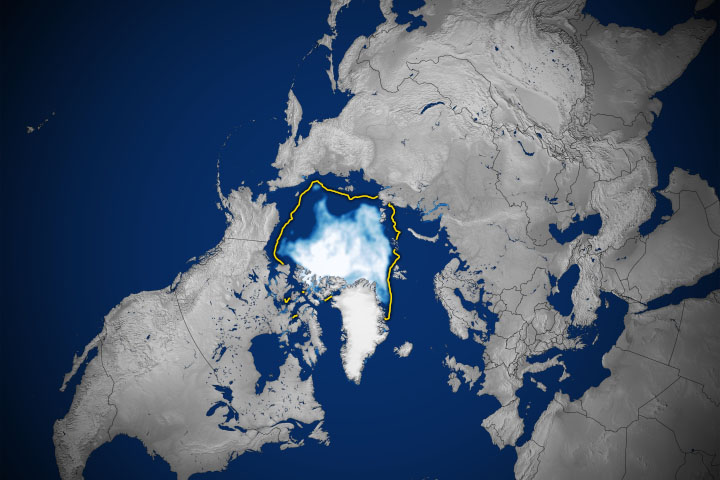
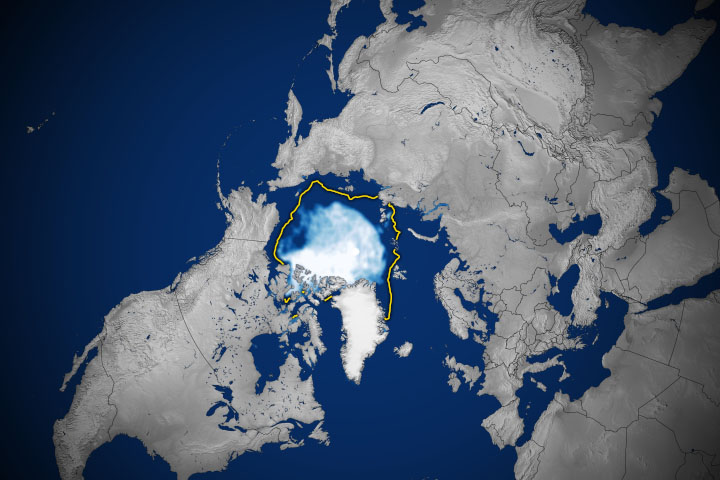
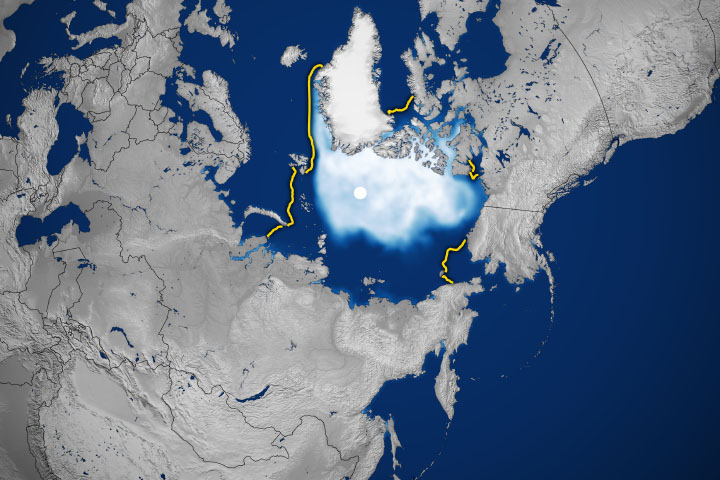
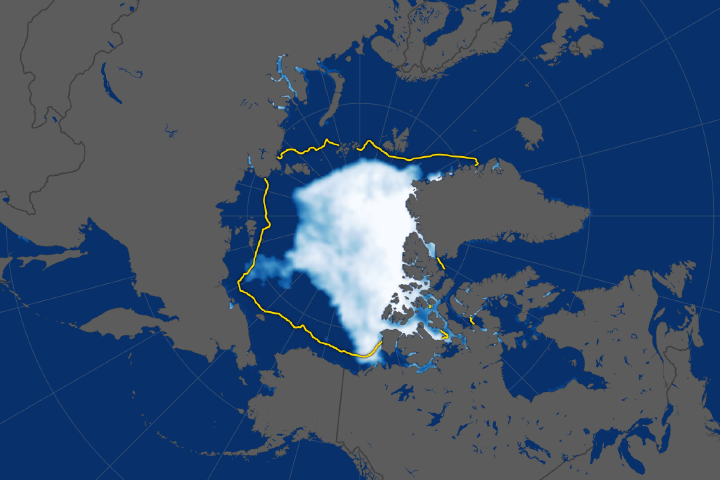
The map above shows the extent of Arctic sea ice as measured by satellites on September 18, 2019. Extent is defined as the total area in which the ice concentration is at least 15 percent. The yellow outline shows the median September sea ice extent from 1981–2010; according to NSIDC data, the median minimum extent for 1979–2010 was 6.33 million square kilometers (2.44 million square miles). Microwave instruments onboard U.S. Department of Defense meteorological satellites monitored the changes from space.
“This was an interesting melt season,” said Walt Meier, a sea ice researcher at NSIDC. The season started with a very low sea ice extent in May, followed by very rapid ice loss in July and the beginning of August. “At the beginning of August, we were at record low ice levels for that time of the year, so a new minimum record low could have been in the offering.”
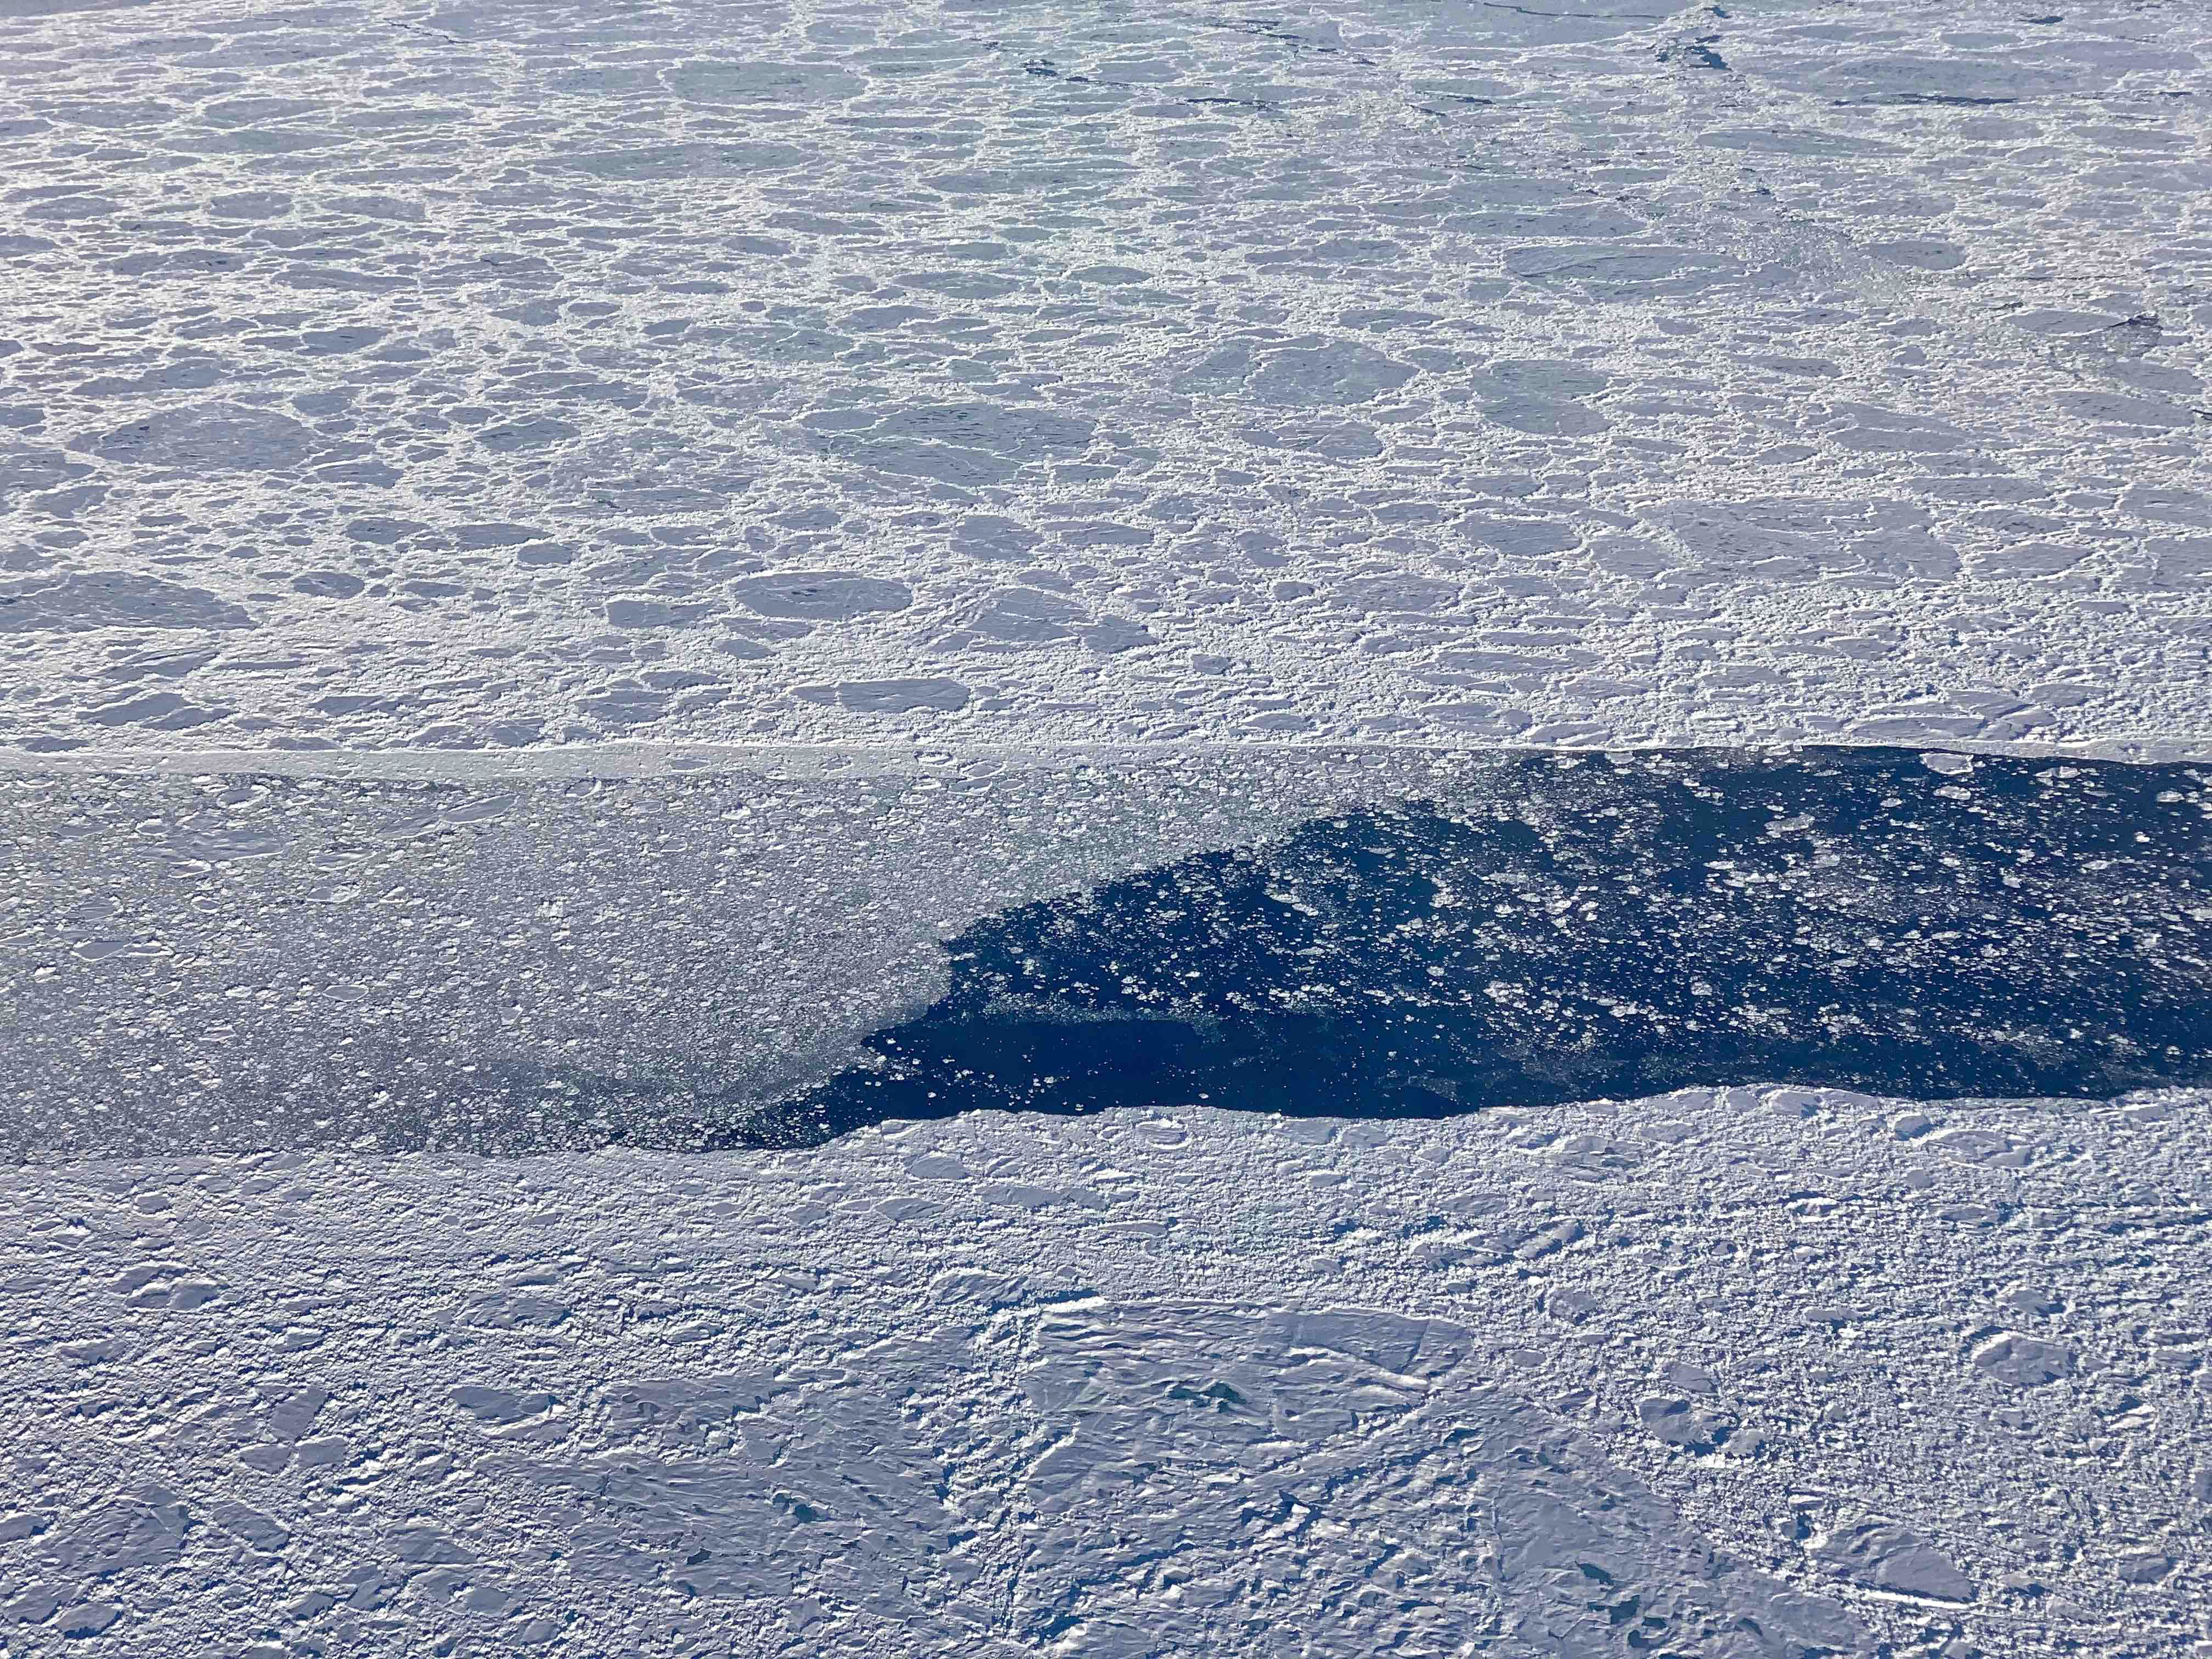
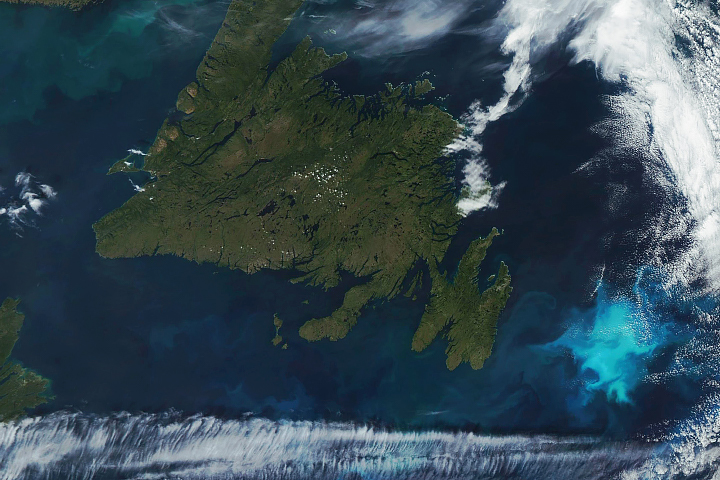
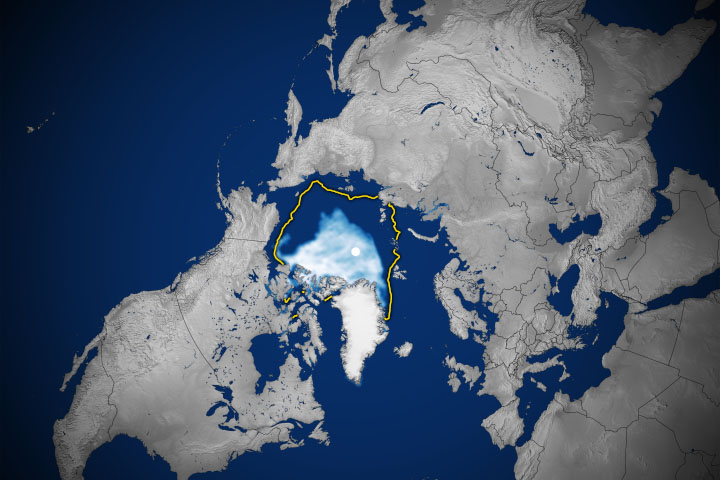
This photo, taken during an Operation IceBridge flight on September 9, 2019, shows an opening in the sea ice cover north of Greenland. The lead is partially filled by much smaller sea ice rubble and floes.
Unlike 2012—when a powerful August cyclone smashed the ice cover and accelerated its decline to the lowest ice extent on record—this melt season did not bring any extreme weather events. Although areas within the Arctic Circle saw average temperatures 4 to 5 degrees Celsius (7 to 9 degrees Fahrenheit) above normal, events such as the severe Arctic wildfire season and the European heat wave did not have much impact on sea ice melting.
“By the time the Siberian fires kicked into high gear in late July, the Sun was already getting low in the Arctic, so the effect of the soot darkening the sea ice surface wasn’t that large,” Meier said. “As for the European heat wave, it definitely affected land ice loss in Greenland and also caused a spike in melt along Greenland’s east coast. But that is an area where sea ice is being transported down the coast and melting fairly quickly anyway.”
NASA Earth Observatory image by Joshua Stevens, using data from the National Snow and Ice Data Center. NASA photograph by Linette Boisvert. Story by Maria-José Viñas, NASA’s Earth Science News Team.