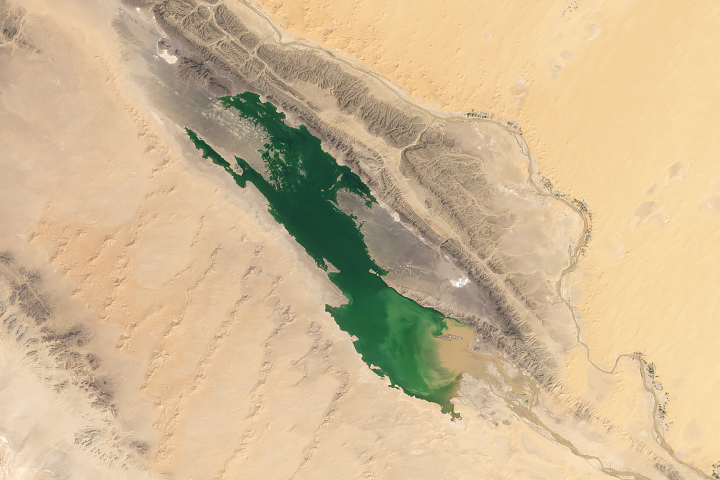
Scientists are studying the rare filling of Sebkha el Melah for clues about past—and possibly future—greening of the Sahara Desert.
The city in southeastern New Mexico received four times more rainfall in a day than it usually receives in a month.
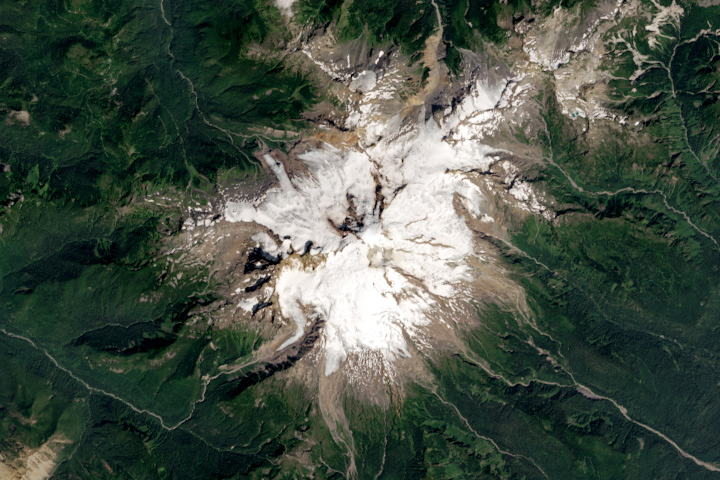
Alpine glaciers around the world were advancing as recently as 1990. Now they’re melting fast.
Published Oct 24, 2024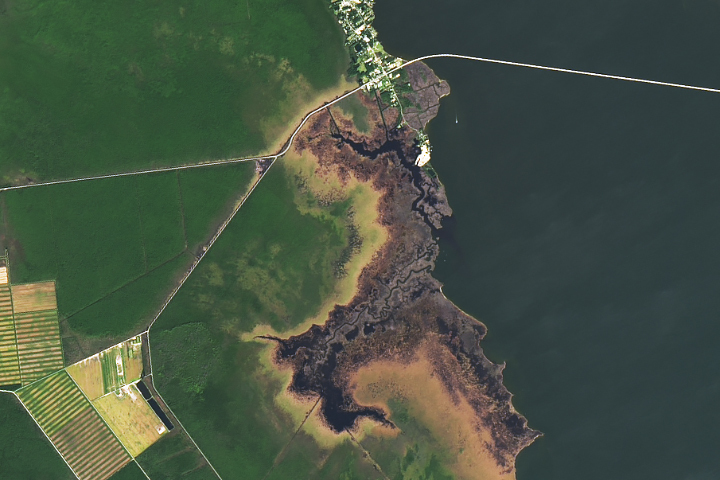
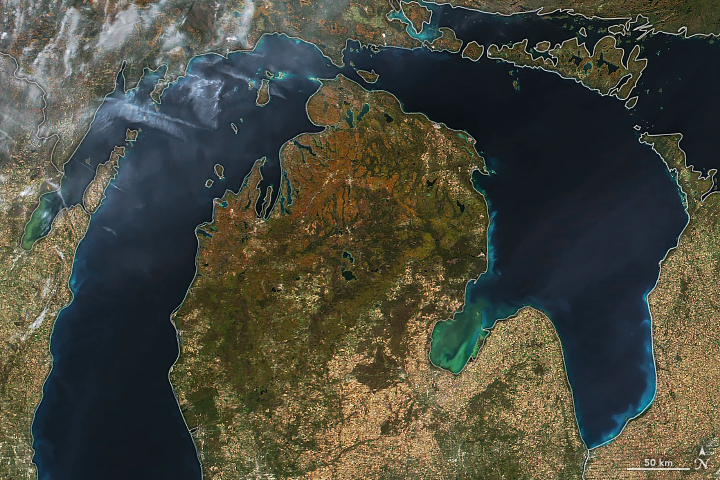
Your challenge is to tell us the location of the satellite image and why it is interesting.
Published Oct 22, 2024
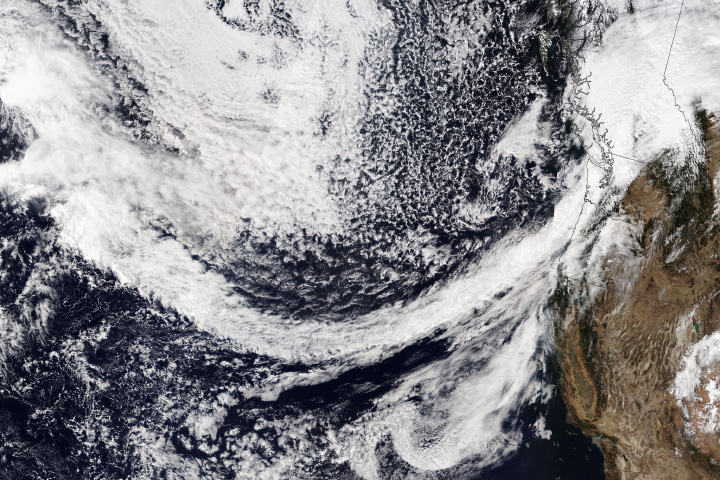
A potent storm brought heavy rain and gusty winds to southwestern Canada and the U.S. state of Washington in October 2024.
Published Oct 21, 2024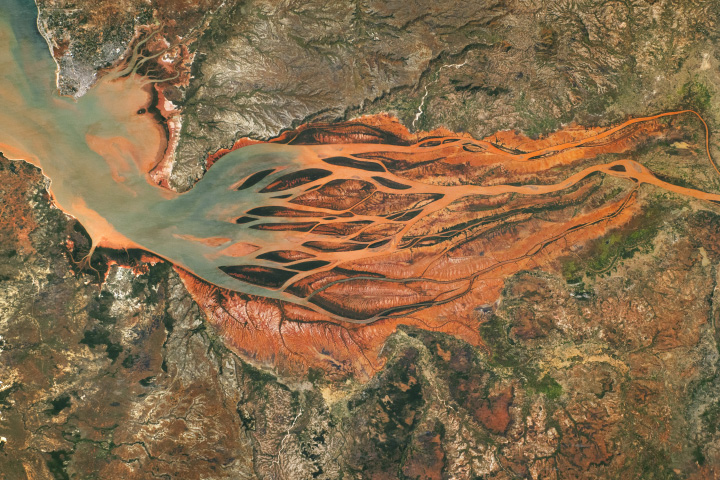
The growing network of channels and islands now spans more than half of the estuary that was once open to ships.
Published Oct 20, 2024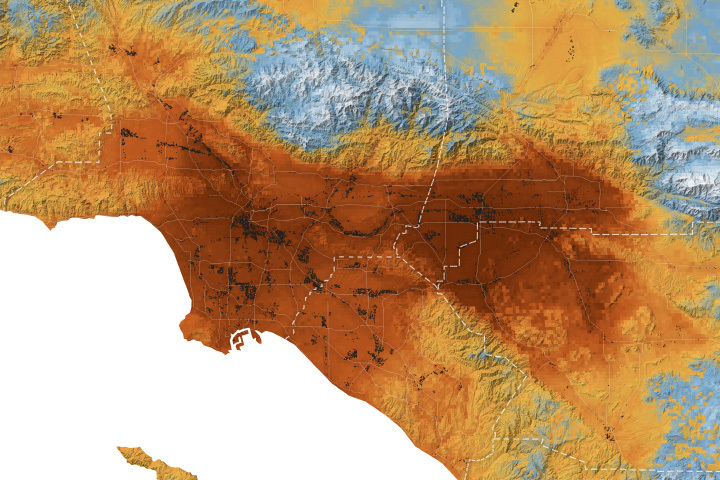
New research shows that the presence of warehouses in the Los Angeles area is associated with higher levels of airborne particulate pollution.
Published Oct 19, 2024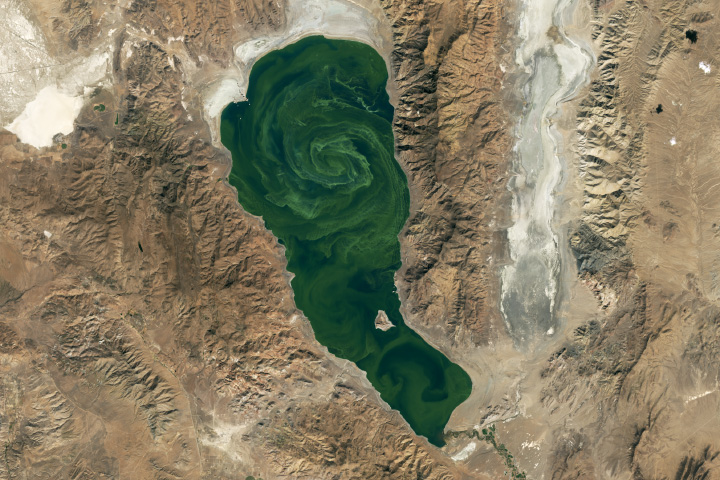
Blooms of cyanobacteria develop in the brackish waters of this Nevada lake nearly every year.
Published Oct 17, 2024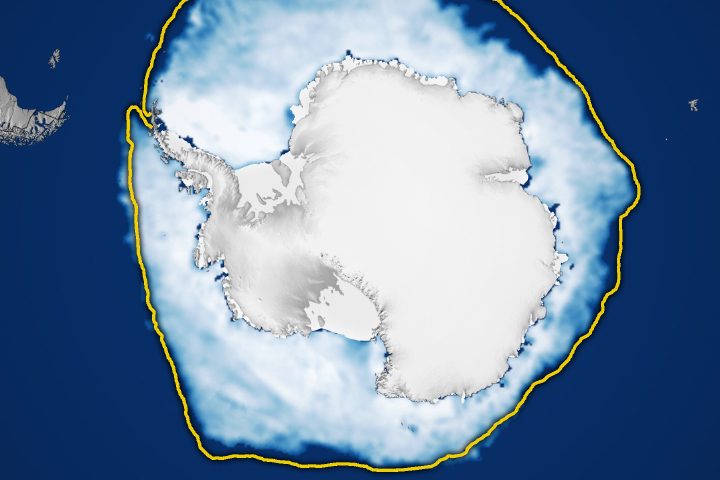
Sea ice in the Arctic continued a decades-long downward trend in its minimum summer extent, while sea ice around Antarctica saw meager winter growth in 2024.
Published Oct 17, 2024
A powerful geomagnetic storm caused a display of light that was visible unusually far from Earth’s poles.
Published Oct 16, 2024
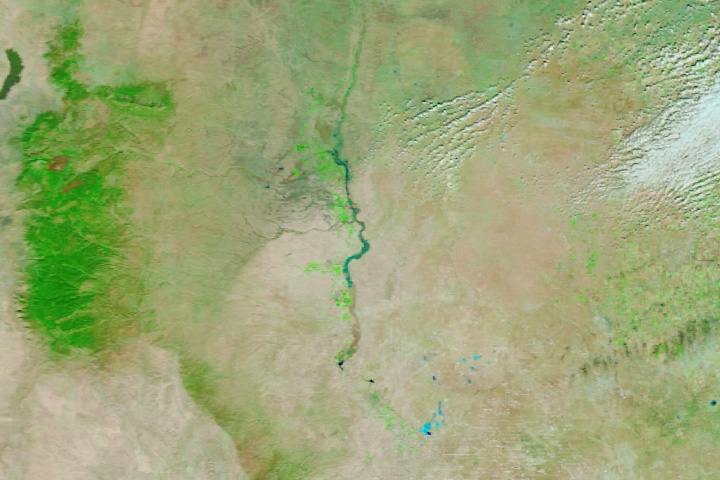
Insufficient rainfall in 2023-2024 has taken a toll on the region’s rivers and groundwater and upended daily life in several countries.
Published Oct 15, 2024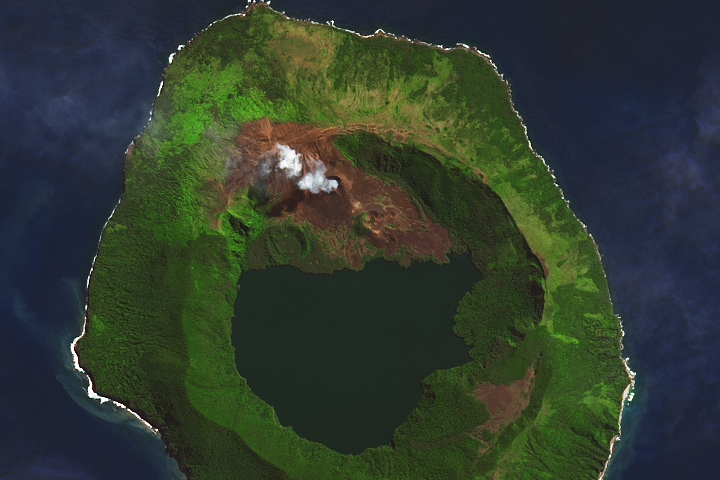
British Royal Naval officer William Bligh and 18 loyalists headed for this volcanic island in Tonga after a mutiny on the HMS Bounty.
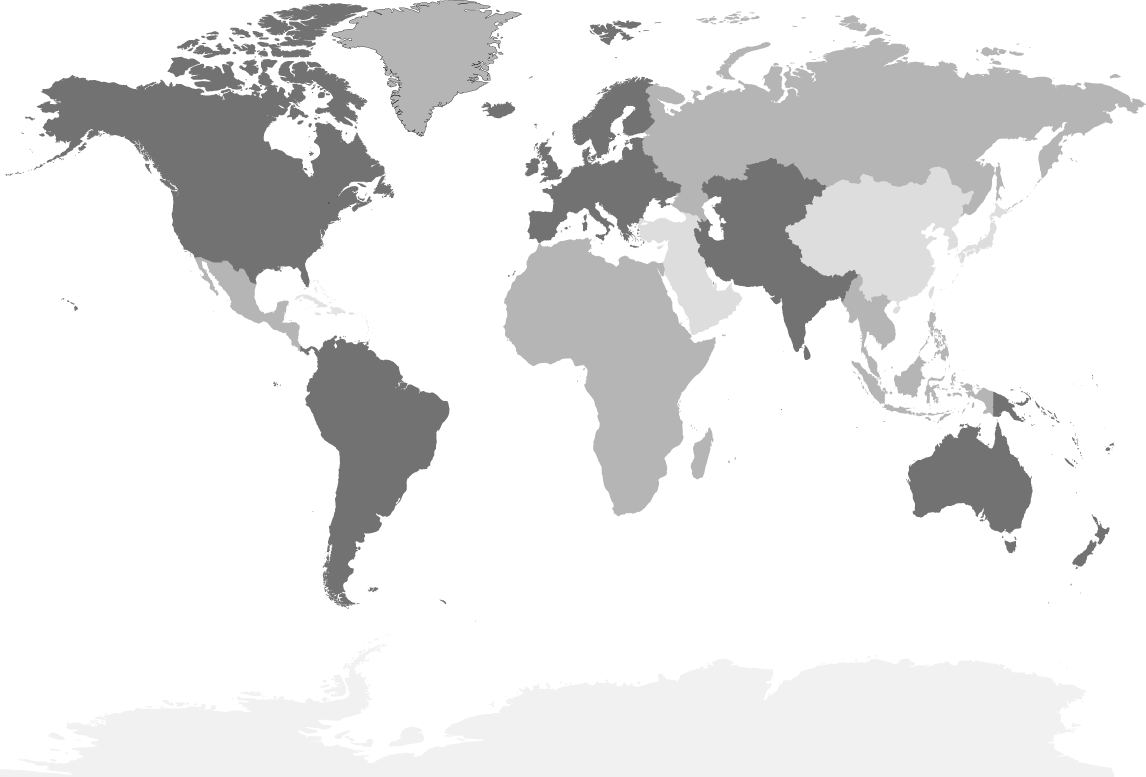
Published Oct 14, 2024Have you ever wondered what it would be like to live in a different part of the world? What would the weather be like? What kinds of animals would you see? Which plants live there? By investigating these questions, you are learning about biomes.
Published Aug 28, 2020
River channels old and new wind across a floodplain in Burma (Myanmar), mingling with areas of agriculture and aquaculture.
Published Oct 13, 2024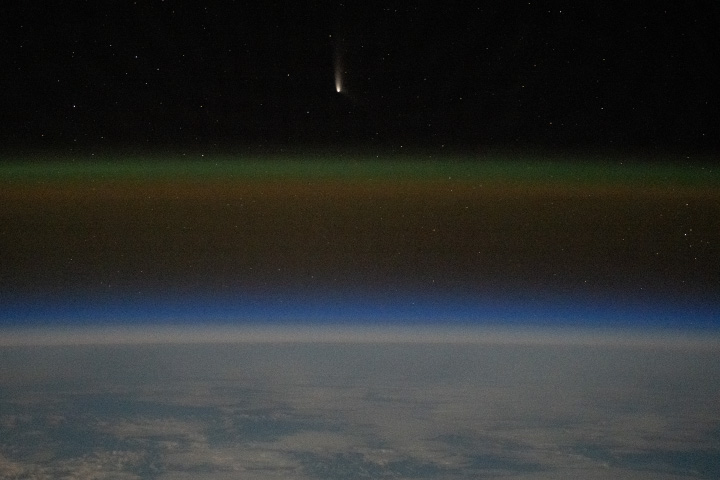
A “dirty snowball” from the distant icy cloud encircling our solar system passed by the Sun and Earth in autumn 2024.
Published Oct 12, 2024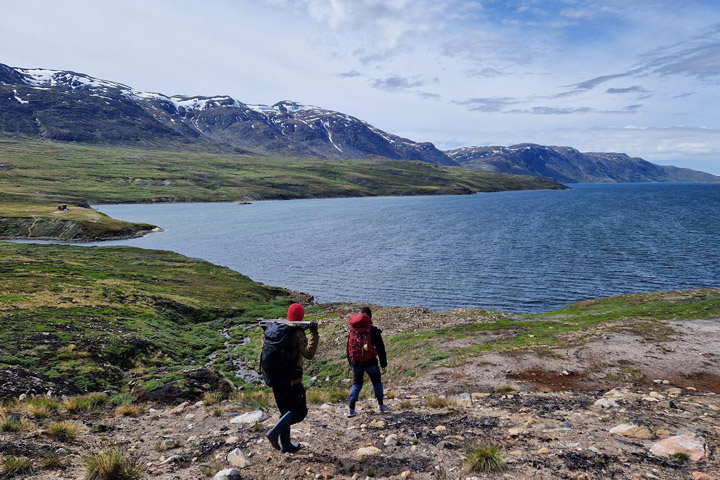
Researchers concluded their 2024 field season in the Canadian territory, where they collected measurements to aid studies of high-latitude wildland fires.
Published Oct 2, 2024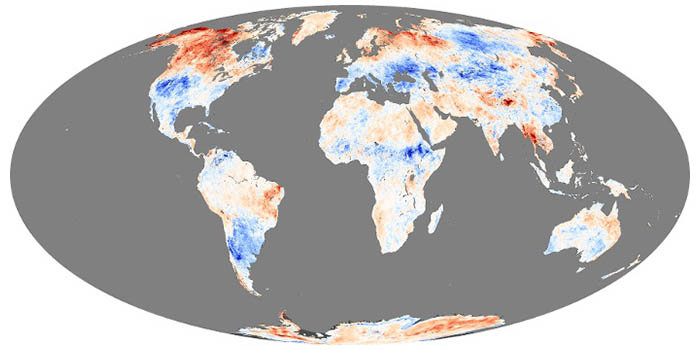
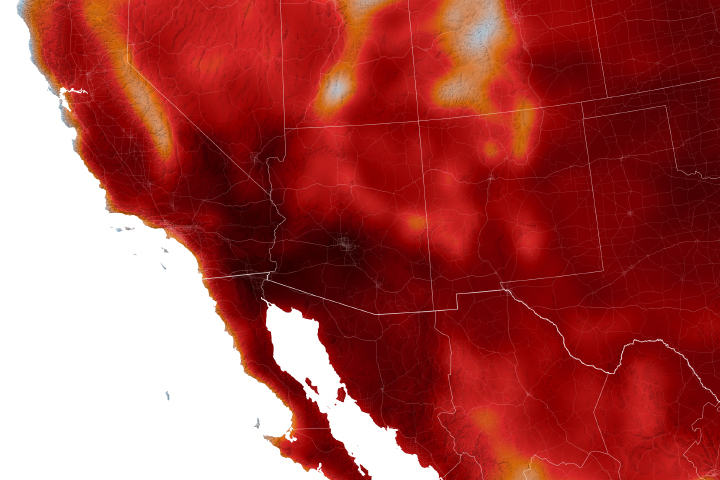
These maps depict anomalies in land surface temperatures (LSTs); that is, how much hotter or cooler a region was compared to the long-term average. LST anomalies can indicate heat waves or cold spells.
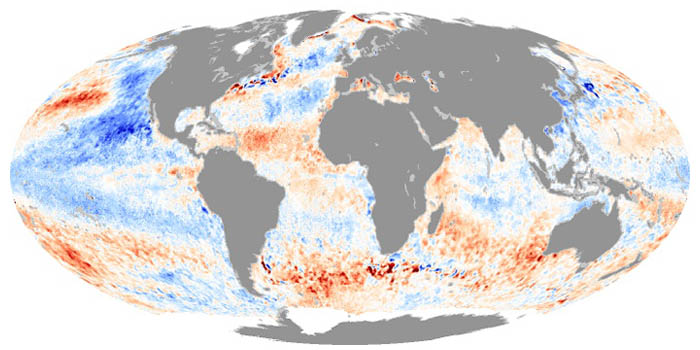
These maps depict how much hotter or cooler an ocean basin was compared to the long-term average. Temperature anomalies can indicate changes in ocean circulation or the arrival of patterns like El Niño and La Niña.
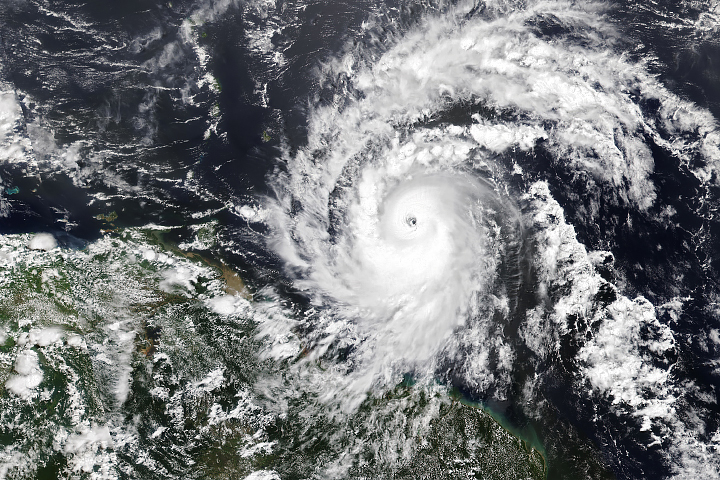
Hurricane season in the basin runs from June 1 to November 30.
Published Jul 1, 2024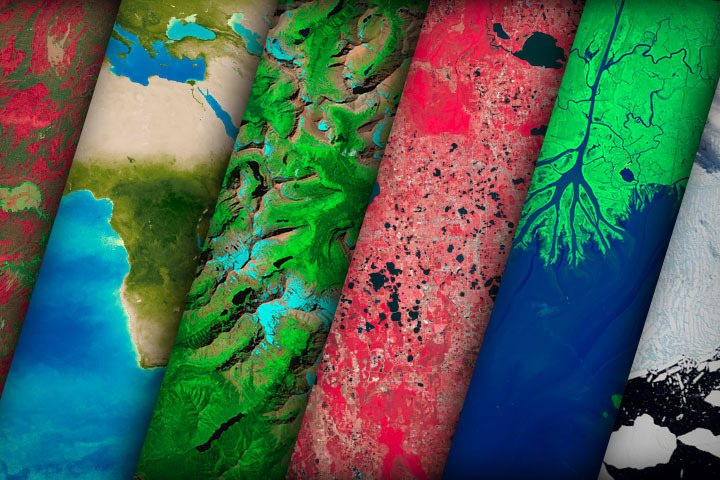
NASA satellites document how our world—forests, oceans, human landscapes, even the Sun—changes over months, seasons, and years.
Published Apr 29, 2009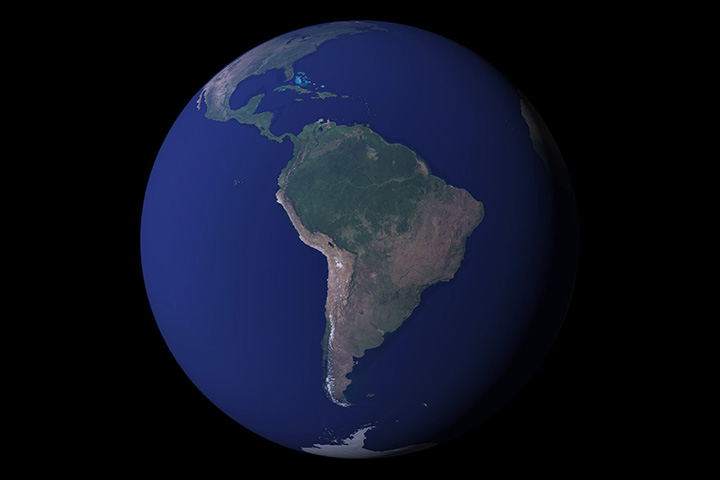
12 months of high-resolution global true color satellite imagery.
Published Oct 13, 2005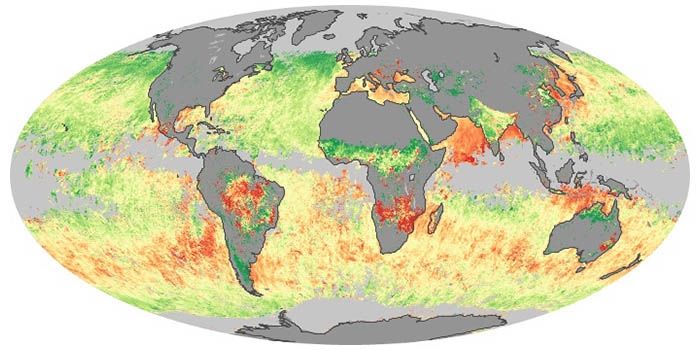
Sea salt, volcanic ash, dust, wildfire smoke, and industrial pollution are types of airborne aerosols. Natural aerosols tend to be larger than human-made aerosols. These maps show when and where aerosols come from nature, humans, or both.
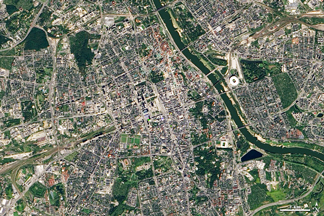
What do you do when presented with a new satellite image? Here's what the Earth Observatory team does to understand the view.
Published Nov 18, 2013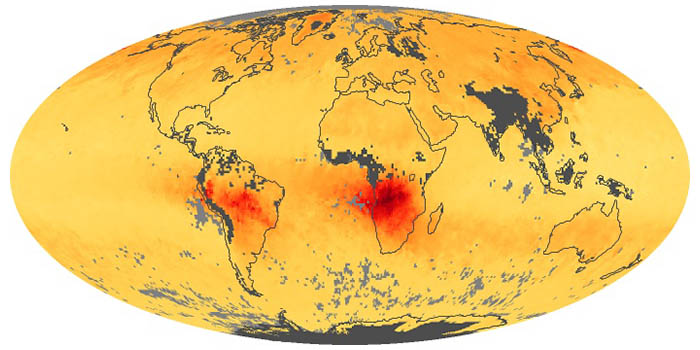
When fuels such as coal, wood, and oil burn incompletely, they produce carbon monoxide. The gas is spread by winds and circulation. These maps show monthly averages of CO in the lower atmosphere.
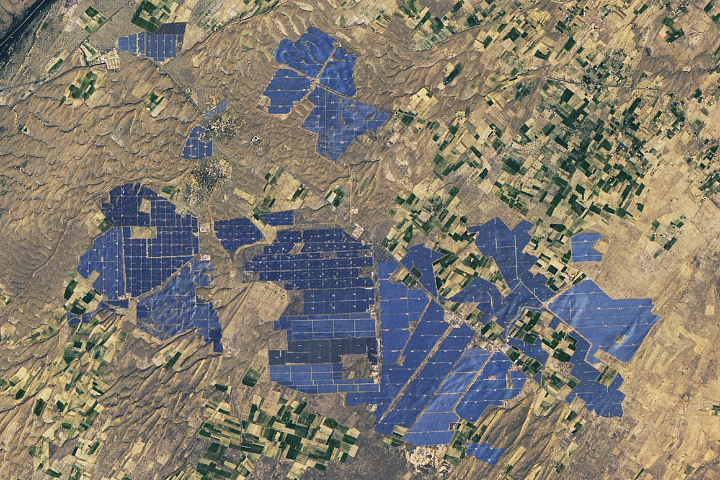
People have developed systems to harvest and store energy from sources such as wind, sunlight, and tidal action. Many of these installations are visible from orbit.
Published May 10, 2024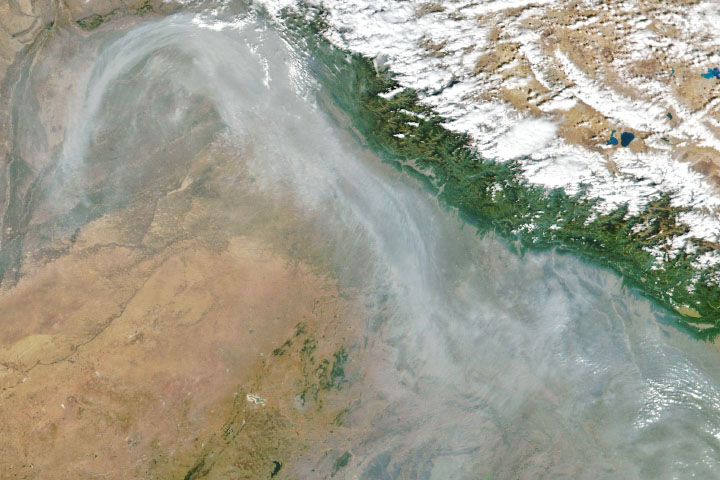
From ground-level ozone to particulate matter to nitrogen dioxide, an array of gasses and particles can affect the air people breathe, with implications for human health.
Published Apr 8, 2024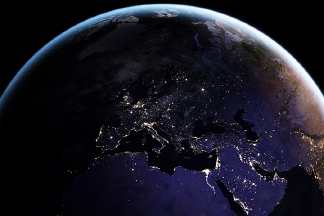
Satellite images of Earth at night have been a curiosity for the public and a tool of fundamental research for at least 25 years. They have provided a broad, beautiful picture, showing how humans have shaped the planet and lit up the darkness.
Published Apr 12, 2017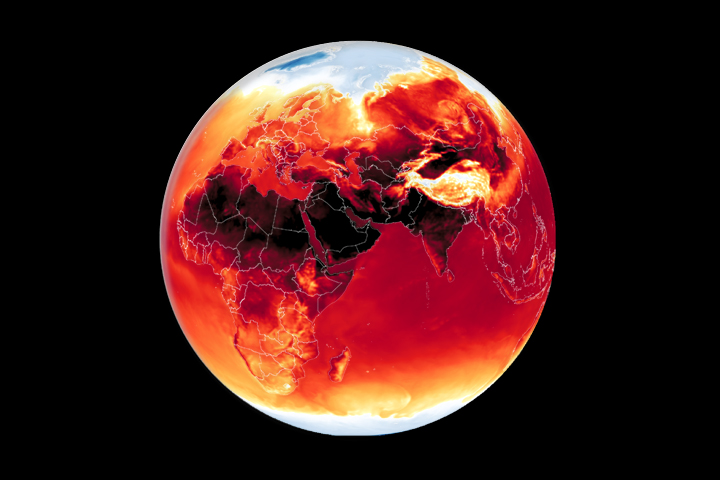
Warmer-than-average temperatures are showing up locally and globally, with consequences for people, landscapes, and ecosystems.
Published Mar 26, 2024
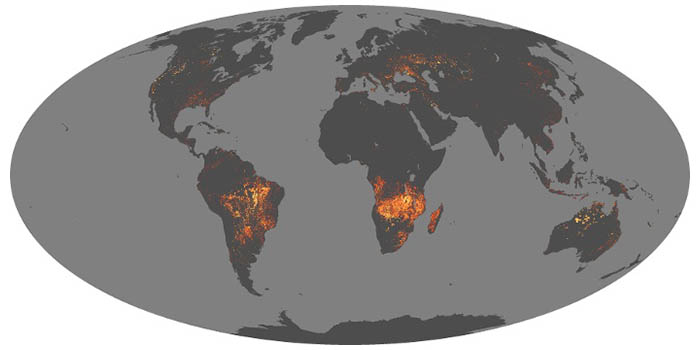
Whether sparked by lightning, intentional land-clearing, or human-caused accidents, wildland fires are burning longer and more often in some areas as the world warms.
Published Feb 27, 2024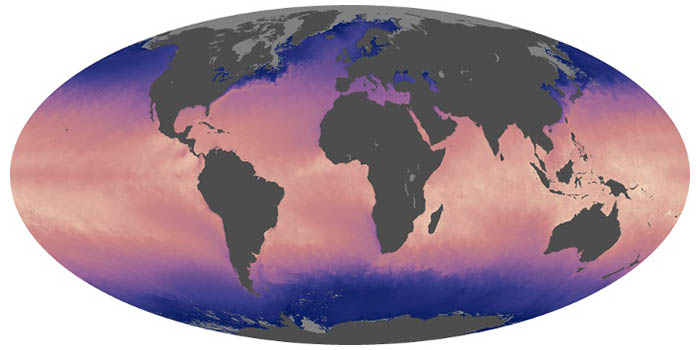
Ocean temperatures can influence weather, such as hurricane formation, and climate patterns, such as El Niño. These maps show the temperature at the surface of the world’s seas and oceans.
Warmer-than-average temperatures are showing up locally and globally, with consequences for people, landscapes, and ecosystems.
Published Aug 15, 2023