Data Fusion |
|||
The EPA’s ground-based, air quality sensors collect actual particles; for example, they capture particles on air filters. They record measurements of air quality in terms of the amount (mass) of pollution per cubic meter of air, and the EPA sets ranges of pollution based on health effects. Satellites see pollution differently. A satellite will produce an image much like a digital photograph, showing an area of grayish haze. To turn the haze they see in satellite pictures into real numbers, scientists make maps of something they call “aerosol optical depth,” which is a way to estimate how much aerosol is in the air by observing how much sunlight passes through. An aerosol optical depth of zero means few aerosols are present, and most of the light is getting through the atmosphere. Progressively higher values mean aerosols are increasing and less light is getting through. The IDEA project is using aerosol optical depth measurements from NASA’s Moderate Resolution Imaging Spectroradiometer on the Terra satellite. |
|||
Szykman and the other scientists involved with the particle-pollution forecasting part of the IDEA project want to track and make forecasts for all aerosol events that reach a pollution concentration of 40.5 to 60.5 micrograms per cubic meter of air, referred to as “Code Yellow: Unhealthy for Sensitive Groups.” Szykman and his colleagues have found that this amount of pollution is equivalent to an aerosol optical depth of about 0.6. When they see a value close to 0.6 on a satellite image, they begin to keep an eye on it for a day or two, comparing what they see from satellite to the ground-based network measurements. If both sources show a trend toward increasing aerosol pollution, the scientists begin combining the aerosol observations with wind speed and air mass movement models using data from the National Weather Service to produce 48-hour forecasts of where the pollution will go. The end products are available to local forecasters via the Web and the Cooperative Institute for Meteorological Satellite Studies (CIMSS) at the University of Wisconsin. |
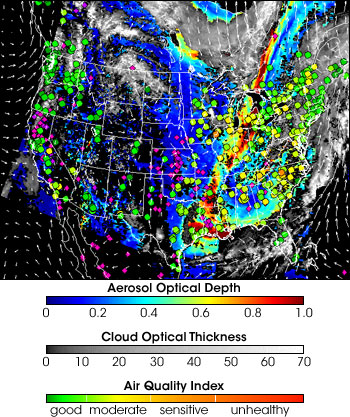
EPA and NASA scientists fuse ground-based measurements with satellite data, meteorological measurements, and computer models to get a big-picture view of air pollution. This data fusion produces a map with several layers of information. The background is satellite data from MODIS, with aerosol optical depth in color (aerosol concentrations increasing from blue to red) and cloud thickness in shades of gray (thickness increasing from gray to white). Wind speed and direction are shown with white arrows, and ground-based measurements of air quality appear as colored dots (air pollution increasing from green to red). Fire locations from the GOES-12 satellite are marked with pink or violet diamonds. The image shows conditions on July 19, 2004. The large area of dense aerosols across the Midwest was caused by widespread fires in Alaska and Canada (see animation). (Map courtesy NASA/EPA/NOAA/CIMSS IDEA program) |
||
This approach to particle-pollution forecasting has been through a couple of test runs this year, and Szykman is optimistic. “We didn’t have the best luck as far as the timing of our pilot study and the timing of aerosol events, but we got at least one good test during the period,” he says. He expects the particle-pollution forecasting part of the IDEA project to be fully operational by the summer of 2004, a prospect that is both personally and professionally rewarding. “Each year the federal government spends a significant amount of public funds on scientific research, and it is an obligation of the different federal agencies to work together on the use of such research for the public benefit. I believe IDEA is a good demonstration of that,” he says. In addition, he says, “the other people involved with this project at both the EPA and NASA are passionate about their work. It’s nice to work with a group of people who enjoy what they do, who like coming to work every day, and who feel they have something to contribute to either science or society in some small, but meaningful way.”
|
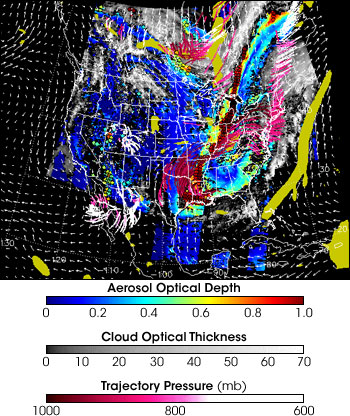
The combined satellite and ground observations are integrated into a computer model to predict the future location of pollution. This image shows the trajectories of aerosols (thick pink and white lines) from July 19, when the data were acquired (see top image), to July 21. Colored areas are measured aerosols, thick lines show trajectories (darker pink indicates air flow toward the surface, white indicates upward air flow), and the ends of the lines indicate the predicted position on the 21st. View the trajectory animation to see the predicted track of the aerosols. (Map courtesy NASA/EPA/NOAA/CIMSS IDEA program) |
||
