EPA and NASA scientists have an IDEA |
|||
Combining the assets of NASA and the EPA with NOAA’s weather information is at the heart of a new NASA Earth Science Applications project called IDEA: Infusing Satellite Data into Environmental Air Quality Applications. The goal of IDEA is to improve the EPA’s decision-making tools with NASA satellite observations for better air quality forecasts. The project was conceived and planned by Szykman, along with Jack Fishman and Doreen Neil, researchers at NASA’s Langley Research Center. Szykman stumbled into research on air quality from a graduate school background in water resources. While his wife was getting a Ph.D. in business at the University of North Carolina, Szykman’s scientific expertise was broad enough to get him a position at the EPA’s office in Research Triangle Park, just outside Raleigh. The office devotes most of its activities to air quality research and national programs. |
|||
 |
|||
“In part, my wife Lisa also prompted my work with NASA,” says Szykman. When she accepted a faculty position at the College of William and Mary, the move brought them within 20 miles of NASA’s Langley Research Center in Virginia. “Jack had a long history of working with the EPA office in Research Triangle Park,” says Szykman, “and the timing seemed to be right to increase the collaboration between NASA and EPA offices there. While there are many others involved with this work, Jack, Doreen, and I had an ‘IDEA’.” First, the team wanted to demonstrate how NASA’s satellite observations could improve computer models—the decision-making tools—used by EPA forecasters to predict pollution caused by aerosols. In the future, they will expand their work into improving computer predictions of other major air pollutants, like ozone or carbon monoxide. What’s in the Air We ShareAccording to Szykman, the collaboration is just a step ahead of a shift in the nation’s data needs for air quality management. Agencies are beginning to realize that air pollution must be tackled on a regional basis: Denver’s “brown cloud” winds up in Rocky Mountain National Park, while the Great Smoky Mountains are hidden beneath the haze of pollution from cities and power plants as far away as Chicago, Detroit, Indianapolis, and St. Louis. In 1997, when the EPA began to enforce stricter rules for controlling ground-level ozone pollution (the cornerstone of smog), 11 states in the Northeast appealed to the EPA for waivers on the grounds that their failure to curb ozone pollution to acceptable levels was because of pollution wafting in from other states. |
The EPA routinely measures ground-level ozone (left) and particle pollution with a diameter of 2.5 micrometers or less (right), the two most significant contributors to regional haze. Measurement locations (colored circles) for air pollutants are widely scattered, and only provide information about current conditions in a localized area (gray areas on maps represent places with no data). To solve regional air quality problems, EPA scientists need to know where pollution comes from and where it ends up. (Maps courtesy EPA AirNow) |
||
 |
|||
While the regions the EPA needs to monitor grow larger, the size of the particles they need to track is growing smaller. In 1997, under the Clean Air Act, the EPA issued a new set of National Ambient Air Quality Standards for fine particulate matter, or PM2.5, which are particles with a diameter less than 2.5 microns. These particles are so tiny—a micron is only one millionth of a meter—that an individual particle can only be seen with a microscope. Spewed by the trillions out of power plants, automobile exhaust pipes, fireplaces, and forest fires, these particles mix with each other and with larger particles to create a hazy blanket that often spreads far from the original source. The EPA calls pollution caused by aerosols “particle pollution.” |
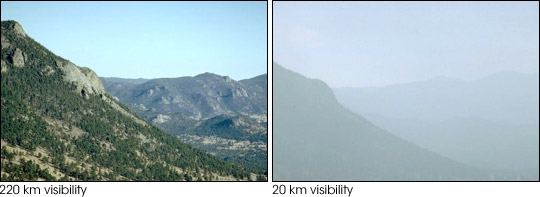
Air pollution often spreads far from its source. These photographs of Rocky Mountain National Park in Colorado show the difference between a clear day (left) and an extremely hazy one (right). The haze often blows into the park from nearby Denver. (Photographs courtesy Interagency Monitoring of Protected Visual Environments) |
||
The PM2.5 particles’ tiny size makes them particularly treacherous to public health because the smaller the size, the easier it is for the particles to slip through the lung’s defenses, causing or worsening breathing problems in many people. According to an EPA report called “Latest Findings on National Air Quality: 2002 Status and Trends,” about 59 million people in the United States—that’s just over 20 percent of us—live in counties where the PM2.5 concentrations regularly exceed the safe limit set by the EPA. In December 2002, the EPA administrator signed a proposed suite of actions to reduce current levels of power plant emissions. One of the actions is the Interstate Air Quality Rule, which targets sulfur dioxide and nitric oxide emissions in 29 Eastern states and Washington, D.C. Those two types of emissions contribute significantly to the fine particle and ozone pollution that creates regional haze, such as the Midwest event Szykman described. The Future of Particle Pollution ForecastingThe need to monitor tiny particles over a wide region is a major change from previous air quality standards, according to Szykman. The EPA’s existing ground-based monitoring networks within North America are located primarily in urban areas. They provide detailed measurements on the kinds and amounts of pollution in the air. “These networks already cost the agency’s Office of Air Quality Planning and Standards about $200 million a year to operate,” says Szykman. “Adapting these existing networks for tracking regional haze would require substantial additions or reconfigurations of existing networks.” When scientists make air quality forecasts these days, they focus on atmospheric processes in the lower atmosphere (near Earth’s surface), urban-scale models of pollution transport, and ground-based measurement networks. This approach works for predicting whether the pollution present in a city today will lift out by tomorrow, or whether joggers should consider taking their daily run on an indoor treadmill, but it wouldn’t have predicted, for example, that smoke from devastating forest fires in southern California in late October 2003 would wind up on the doorsteps of Maine in early November. That is where NASA comes in. Not only do NASA scientists have experience in creating and running regional-and global-scale models of how the atmosphere moves aerosols around, but they also have satellites that observe aerosols on regional and even global scales. While EPA’s measurements are more detailed but localized, NASA’s satellite measurements are less specific but comprehensive. According to Szykman, fusing these complementary approaches is the future of particle pollution forecasting. Using this technique for other major pollutants, like ozone or carbon monoxide, could revolutionize how forecasters determine the overall air quality for a region. |
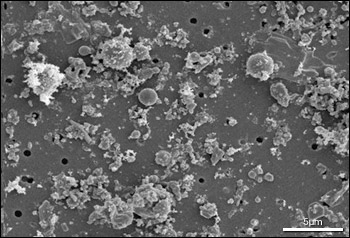
This image shows a magnified view of aerosol particles collected in the industrial city of Port Talbot, England. Many of the particles measure roughly 2.5 microns across, small enough to easily enter and damage human lungs. (Micrograph adapted from Sixth Annual UK Review Meeting on Outdoor and Indoor Air Pollution Research 15th–16th April 2002 (Web Report W12), Leicester, UK, MRC Institute for Environment and Health) |
||
