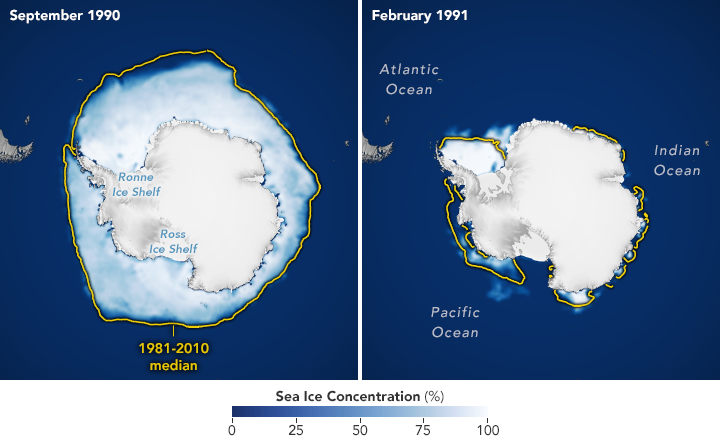
Unlike the Arctic—an ocean basin surrounded by land—the Antarctic is a large continent surrounded by an ocean. Because of this geography, sea ice has more room to expand in the winter. But that ice also stretches into warmer latitudes, leading to more melting in summer. Antarctic sea ice peaks in September (the end of Southern Hemisphere winter) and usually retreats to a minimum in February.
These image pairs show the average concentration of Antarctic sea ice for the month of September (left) and the following February (right) from September 1990 to February 2021. Opaque white areas indicate the greatest concentration, and dark blue areas are open water. All icy areas pictured here have an ice concentration of at least 15 percent (the minimum at which space-based measurements give a reliable measure), and cover a total area that scientists refer to as the “ice extent.”
The yellow outline shows the median sea ice extent in September and February from 1981 to 2010. Extent is the total area in which the ice concentration is at least 15 percent. The median is the middle value; that is, half of the extents were larger than the line, and half were smaller.
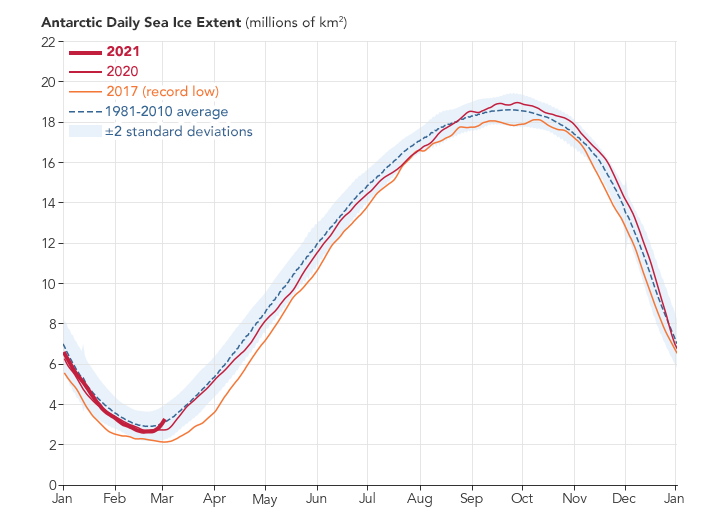
From the start of satellite observations in 1979 to 2014, total Antarctic sea ice increased by about 1 percent per decade. Whether the increase was a sign of meaningful change is uncertain because ice extents vary considerably from year to year around Antarctica. For three consecutive Septembers from 2012 to 2014, satellites observed new record highs for winter sea ice extent. These highs occurred while the Arctic was seeing record lows.
The climb came to an end in 2015, and significant decreases in sea ice around Antarctica started to occur in 2016. There have been small rebounds in recent years, but nowhere near the record high of 2014.
Within Antarctic sea ice, there is variation from place to place around the continent. Sea ice extent has increased somewhat in the eastern Ross Sea sector, while it has decreased in the seas around the Antarctic Peninsula. In short, Antarctic sea ice shows a nearly flat trend, but large-scale variations make the trend very noisy.
The time series above is made from a combination of observations from microwave sensors flown on a series of Defense Meteorological Satellite Program missions. The sensors measure microwave energy radiated from the Earth’s surface (sea ice and open water emit microwaves differently), which can be used to map sea ice concentrations.
