How to build better climate models |
| |
Many Earth system scientists routinely use computer models in their
research. Yet they have generally moved beyond the creation of new models, and
are working to improve the existing ones. A model isn't finished until it
realistically portrays the system it is designed to simulate and accurately
predicts how that system will change in the future. The point is that, today,
Earth system science is less likely to result in totally new discoveries than it
is to gradually revise our understanding of our complex home planet through a
deliberate, iterative process (sort of like peeling an onion, one layer at a
time). |
||
According to Levine, the sophistication of the model reflects the maturity of the science. In the 1980s, when Levine was still a Ph.D. student at Penn State University, she studied the effects of acid rain on soil using a simulation model. Levine used existing soil profile information that described the physical and chemical properties of the soil at various depths. She also used climate information that described the amount and acidity of the precipitation falling on the soil. Then she ran her simulation model to predict the changes in soil chemistry over time, and to identify soils that would be sensitive to acid rain inputs. Levine found that certain soils are more sensitive to, while others are more tolerant of, acid rain. She describes the sensitive ones as shallow, letting water pass through quickly. Shallow soils typically don’t have much capacity for holding nutrients and they don't contain much organic matter. Conversely, soils that are more tolerant of acid rain are generally thicker, more fertile, contain more organic matter, and filter water through more slowly. In the shallow, sandy, and low buffering soils, Levine found that, over time, acid rain decreases fertility, increases the acidity of the soil, and affects the biological contents (bacteria, worms, etc.) of the soil. When she came to NASA in 1987, Levine was asked to understand the soils of
the entire world. Her challenge: how to extrapolate from digging holes at
single sites to mapping the soils of the Earth? The most burning scientific
questions did not allow her to look at soils in isolation, but instead to
recognize the role soils play in the whole ecosystem. She began working with
scientists in other disciplines to identify links between each of the subsystems
of the natural environment. (Here, "subsystems" refers to all of the
small components within the natural environment that are contained within, and
comprise, the terrestrial ecosystem.) |
| |
"It turns out,
the interfaces between Earth’s subsystems are where
most of the significant processes are happening," Levine observes.
"To understand things like the exchange of carbon dioxide between the soil
and the atmosphere, or the uptake of nutrients from the soil by plants, or the
return of nutrients through rain and litter back to the soil--to understand all
of these things requires us to examine the interfaces between Earth’s
subsystems." |
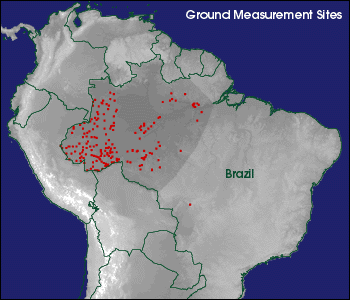
The ground-based soil sampling sites shown here (red dots), scattered throughout Brazil's Amazon Basin, can not provide enough data to map the entire region. However, these data are used to "train" computer models to recognize patterns in satellite imagery that relate to conditions on the surface that can not otherwise be measured remotely. (Image by Steve Fifer, NASA Goddard Space Flight Center) | |
Today, Levine is using her data-driven modeling approach to map soil and vegetation types across Amazonia, South America. Her goal is to find out how much carbon is stored in the soils there. Using data from 200 sites on the ground in the Brazilian Amazon, Levine and her colleagues "trained" a neural network using soil, land cover data, and satellite imagery. (Levine’s model uses a program that can improve itself, or learn, by comparing its predictions to real measurements and then revising its processing algorithm. The process of preparing a given model to make certain types of predictions is called "training the model," which in this case is Levine’s neural network.) Levine then used the trained model to estimate the amount of soil carbon present in the Amazon region based on satellite imagery alone (Levine and Kimes 1998). Next she is planning to generate soil-carbon maps for a larger portion of the Amazon region--a task that would take many years to complete if she relied solely on ground-based measurements. The Leap from ‘Local’ to ‘Global’
"In adopting a global perspective, we learned that we need to stop
worrying about each plant as an individual," Running explains. "In
producing remote sensing data products like the Normalized Difference Vegetation
Index (NDVI), we began to think more abstractly about the biosphere as a
‘chlorophyll sponge.’ Land surface cover became an aggregation of all
vegetation, not individual plants." |
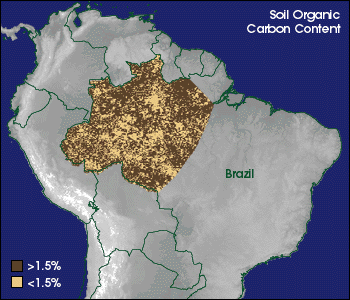
This map, derived from a model that combines data from ground stations (top of page) with satellite imagery, shows soil organic carbon content where it is difficult to obtain these measurements directly. (Image by Steve Fifer, NASA Goddard Space Flight Center) | |
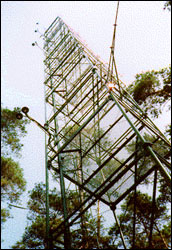
Running is quick to point out that global-scale modelers did not abandon the strategy of direct measurements that got them here. Rather, most modelers use a nested approach in which model results are compared to actual measurements (or validation data) obtained at multiple sites around the globe. Running’s team coordinated the establishment of a worldwide network of towers equipped to measure a range of variables in the atmosphere (temperature, humidity, precipitation, carbon dioxide levels, sunlight, etc.) and on the ground (canopy types, carbon dioxide taken in and released during photosynthesis, foliage produced, etc.). Called FLUXNET, the network of instrumented towers automatically records data every five minutes. These data are stored and later compared with satellite measurements, as well as model results. It is the ongoing comparison of model results with real data that enables scientists to continue refining their models toward a real predictive capability. Already, climate models are showing promise that they will enable scientists to forecast certain changes months or even years ahead of occurrence. |
|