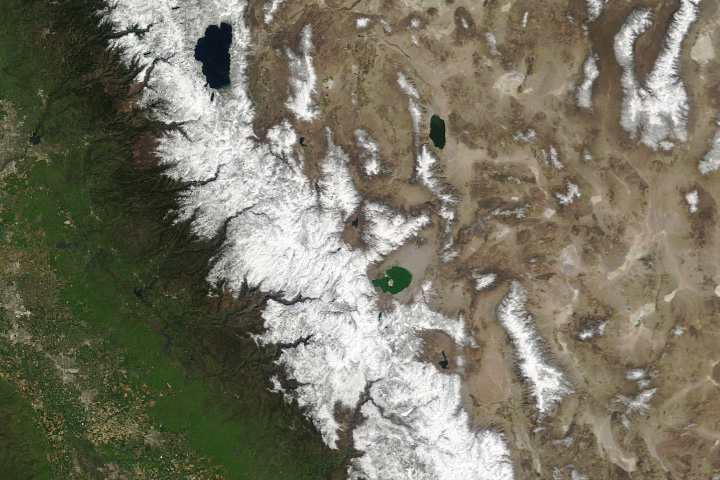
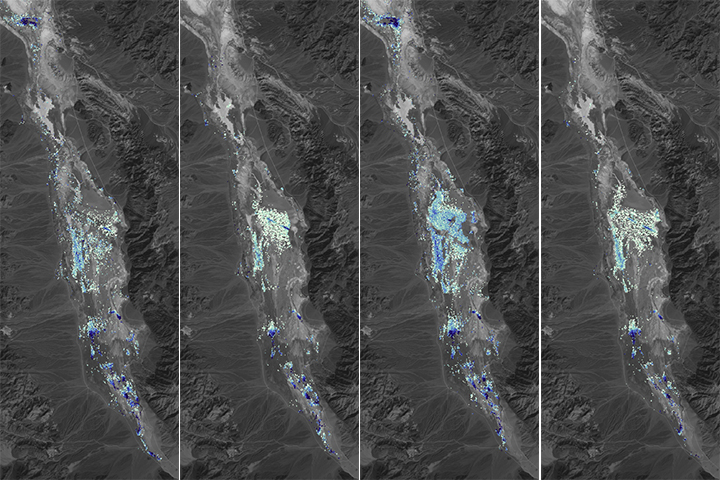
The amount of snow in the California-Nevada mountain range was about average in April 2024—a rare occurrence.
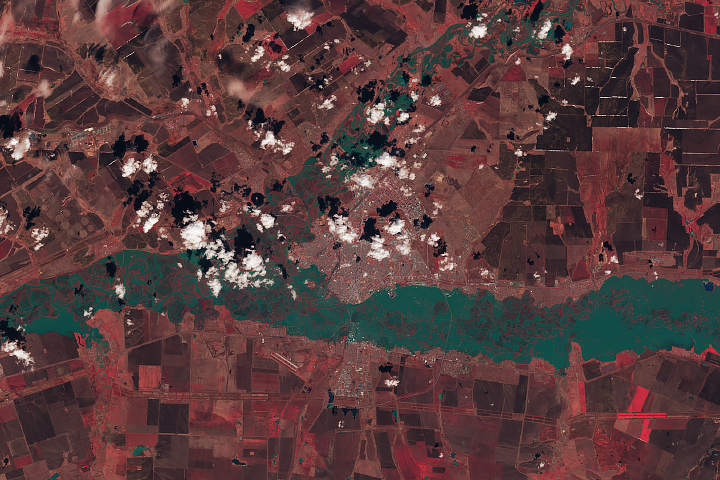
Rivers overtopped their banks and submerged thousands of homes in Russia and Kazakhstan.
Researchers used satellite data to calculate the depth of water in this transient freshwater body.
Published Apr 16, 2024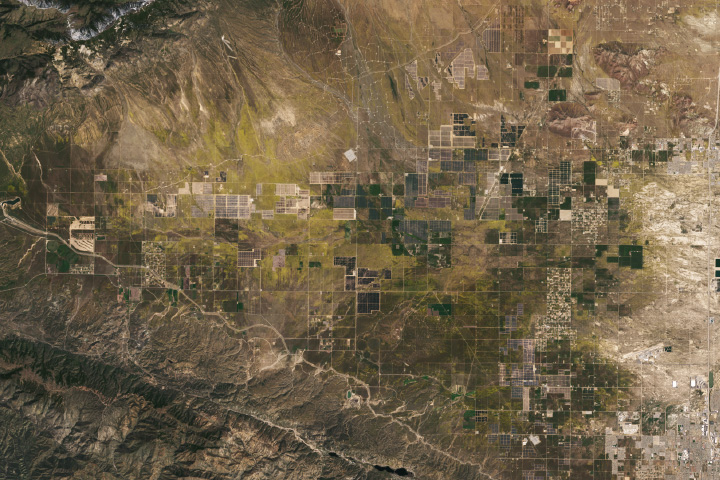
Poppies are sparse, but yellow wildflowers are blooming in Southern California.
Published Apr 15, 2024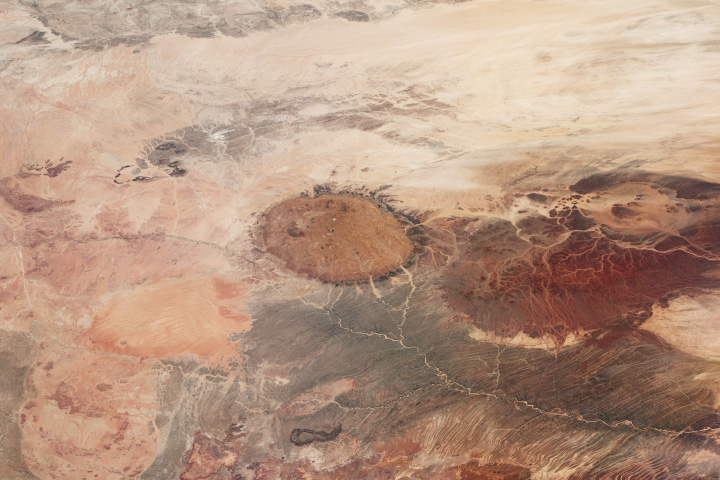
This reddish “burning mountain” of granite is the highest point in Namibia.
Published Apr 14, 2024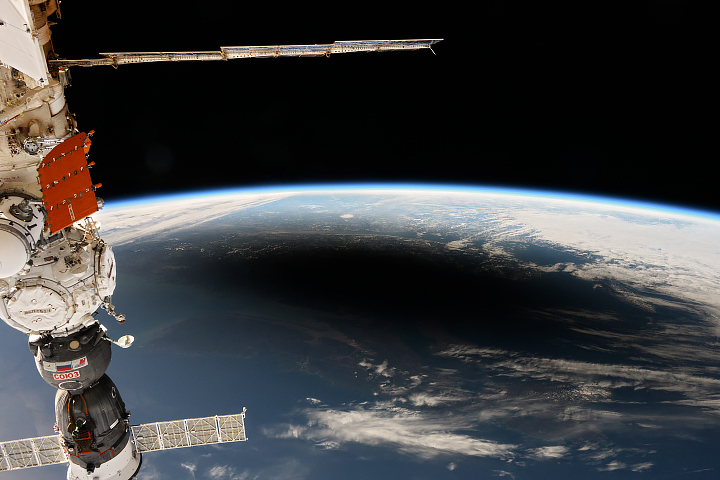
Astronauts and photographers captured unforgettable views of Earth and the Sun as the Moon’s shadow swept across North America.
Published Apr 12, 2024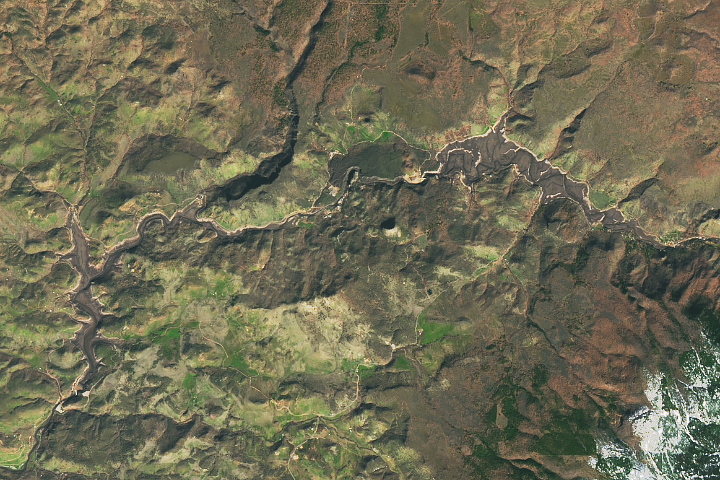
Human-made lakes along the western U.S. river were drained as part of the world’s largest dam removal project to date.
Published Apr 11, 2024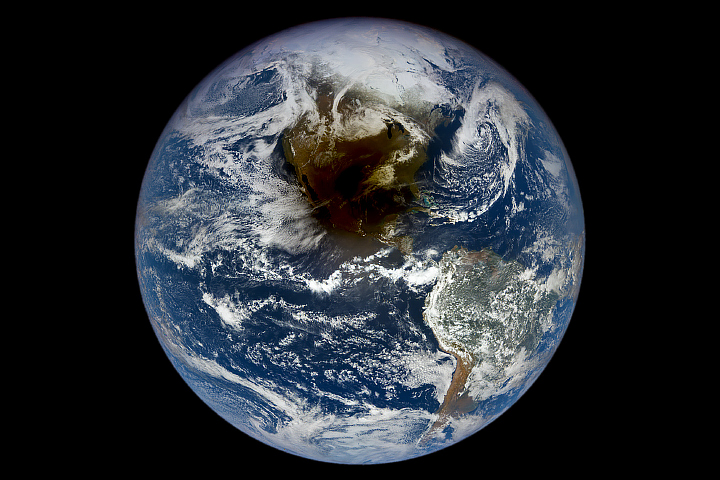
Satellites gathered striking views of the Moon’s shadow from above as observers on the ground were awed by the Sun’s corona.
Published Apr 9, 2024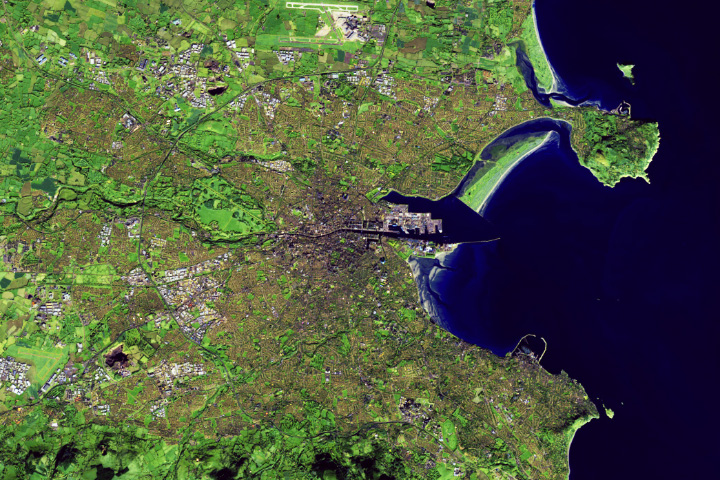
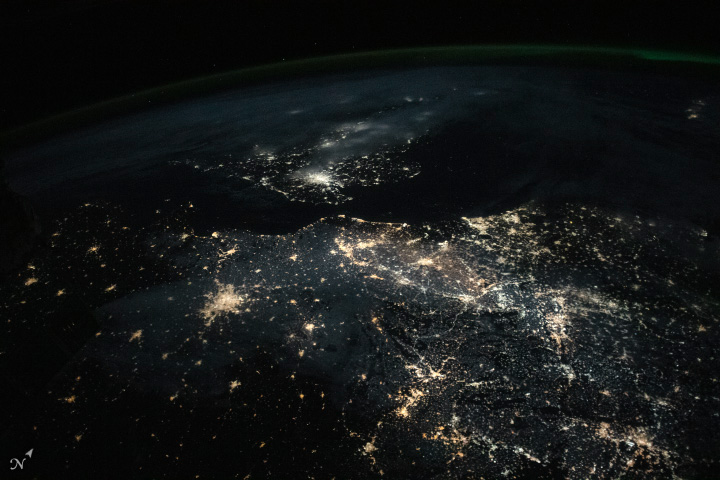
Images spanning four decades show how buildings and blacktop have spread into Ireland’s countryside.
Published Apr 9, 2024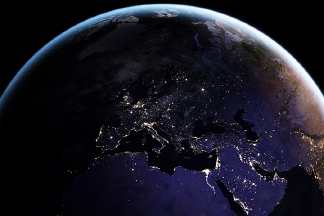
Satellite images of Earth at night have been a curiosity for the public and a tool of fundamental research for at least 25 years. They have provided a broad, beautiful picture, showing how humans have shaped the planet and lit up the darkness.
Published Apr 12, 2017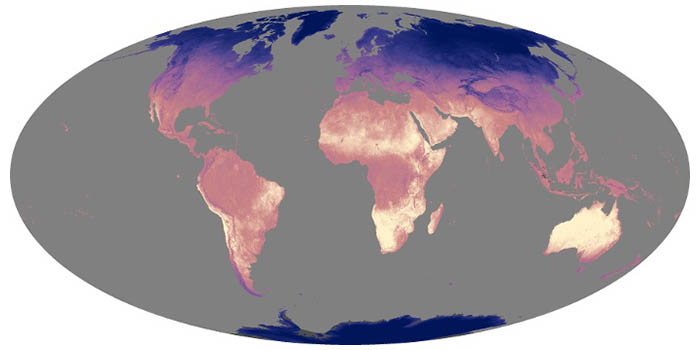
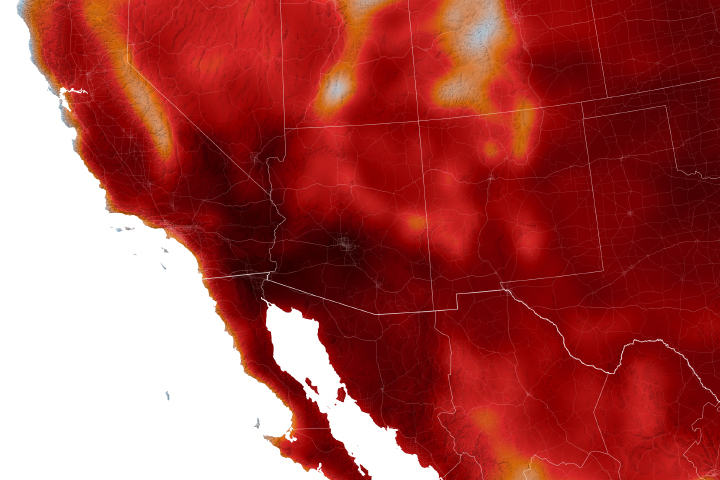
Land surface temperatures rise and fall with the heat of the Sun, and they represent how hot or cold the surface would feel to touch. These maps show daytime land temperatures as measured from space.
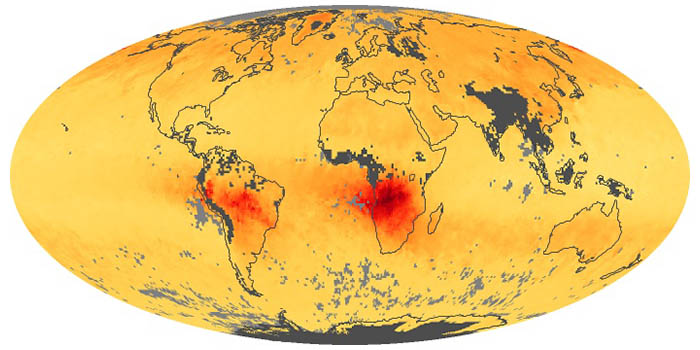
When fuels such as coal, wood, and oil burn incompletely, they produce carbon monoxide. The gas is spread by winds and circulation. These maps show monthly averages of CO in the lower atmosphere.
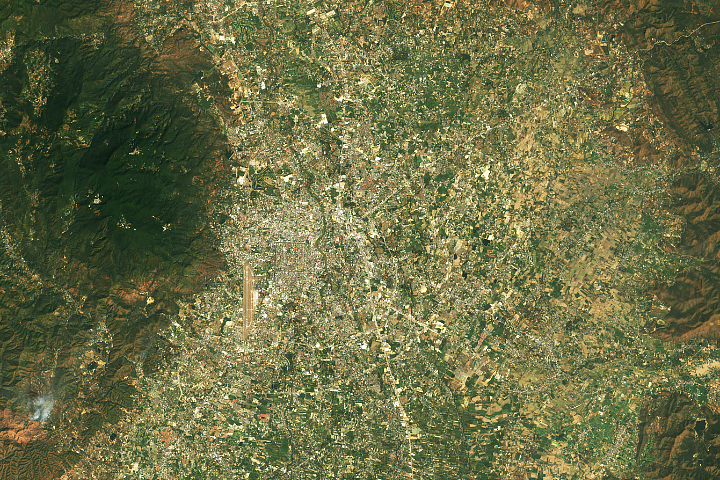
Chiang Mai, a city in northern Thailand popular with tourists, faces seasonal spikes in air pollution.
Published Apr 8, 2024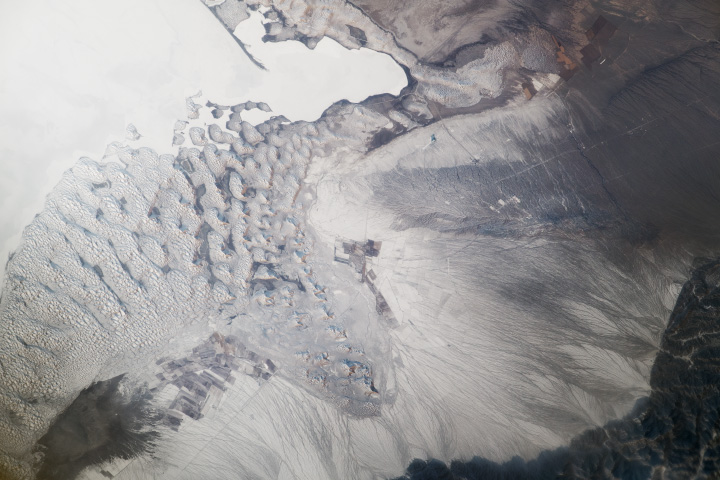
Distinct textures stand out in this winter scene around Bositeng Lake in China’s Xinjiang region.
Published Apr 7, 2024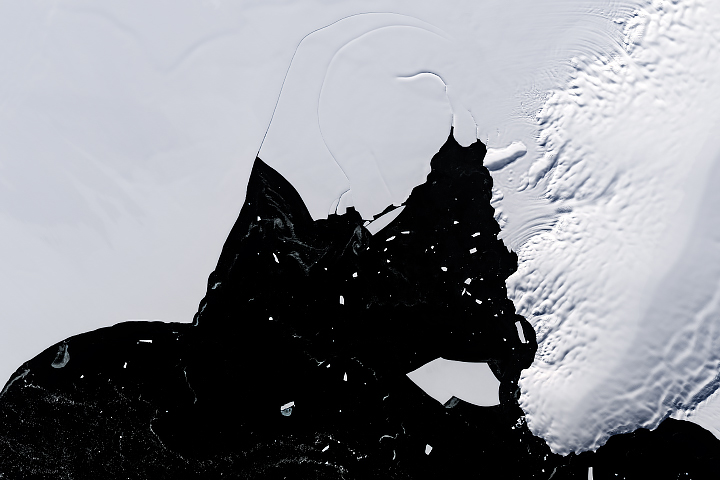
Signs of structural weaknesses may signal a shift in this Antarctic ice shelf’s stability.
Published Apr 6, 2024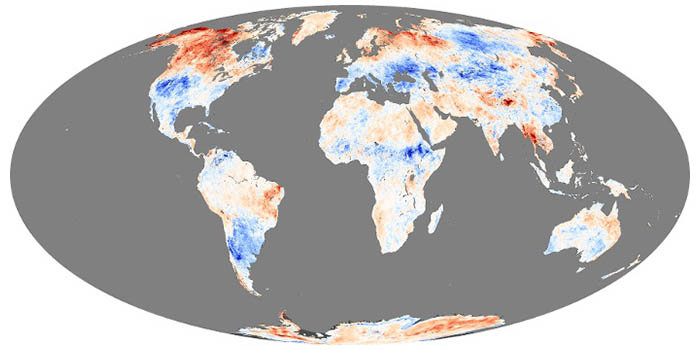
These maps depict anomalies in land surface temperatures (LSTs); that is, how much hotter or cooler a region was compared to the long-term average. LST anomalies can indicate heat waves or cold spells.
12 months of high-resolution global true color satellite imagery.
Published Oct 13, 2005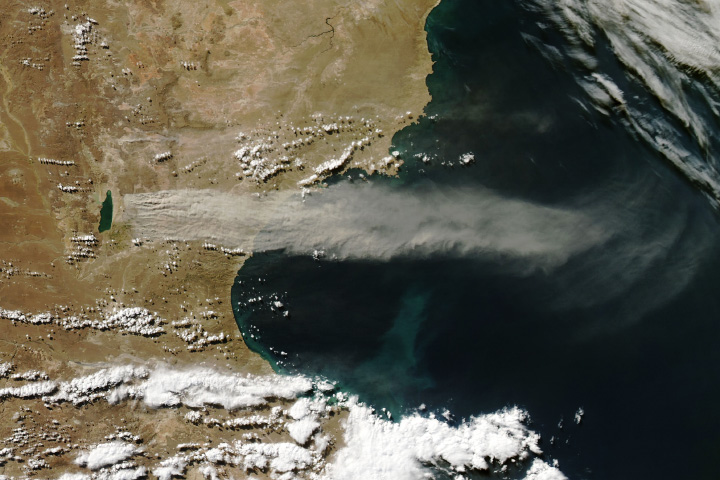
Strong winds that race across Lago Colhué Huapi have exposed ancient artifacts amid the dusty surface.
Published Apr 4, 2024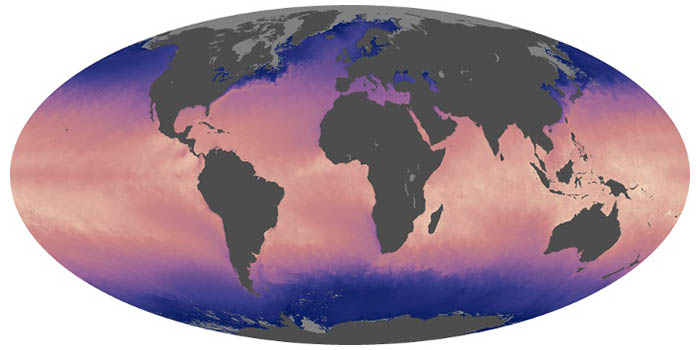
Ocean temperatures can influence weather, such as hurricane formation, and climate patterns, such as El Niño. These maps show the temperature at the surface of the world’s seas and oceans.
Warmer-than-average temperatures are showing up locally and globally, with consequences for people, landscapes, and ecosystems.
Published Aug 15, 2023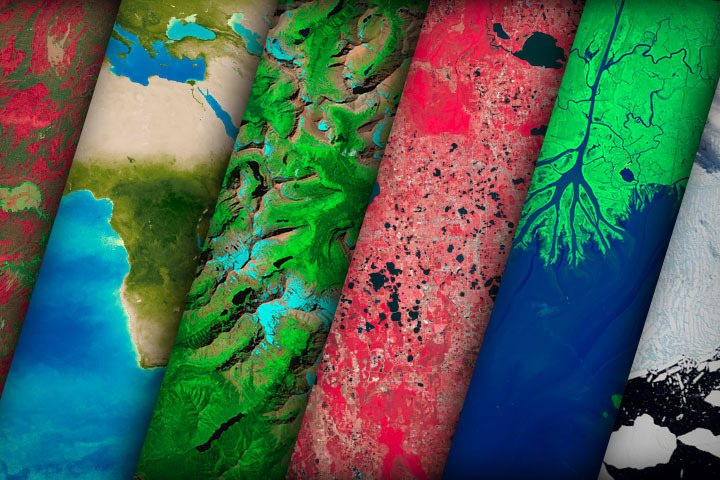
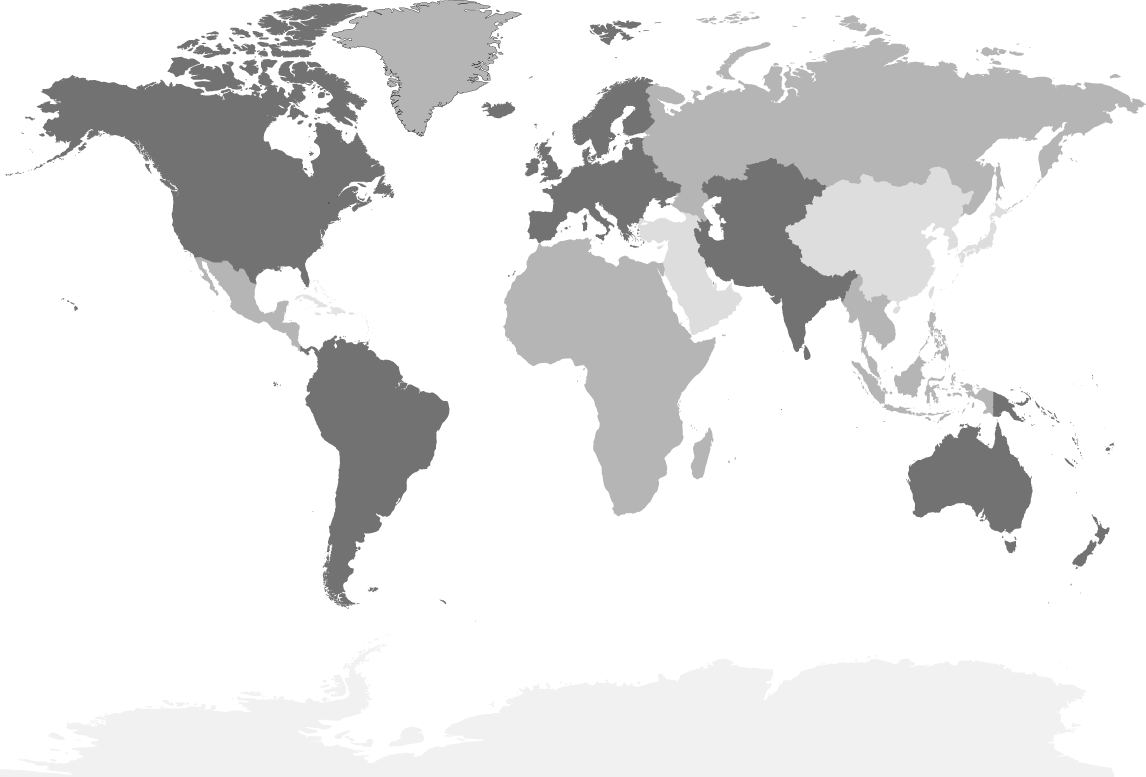
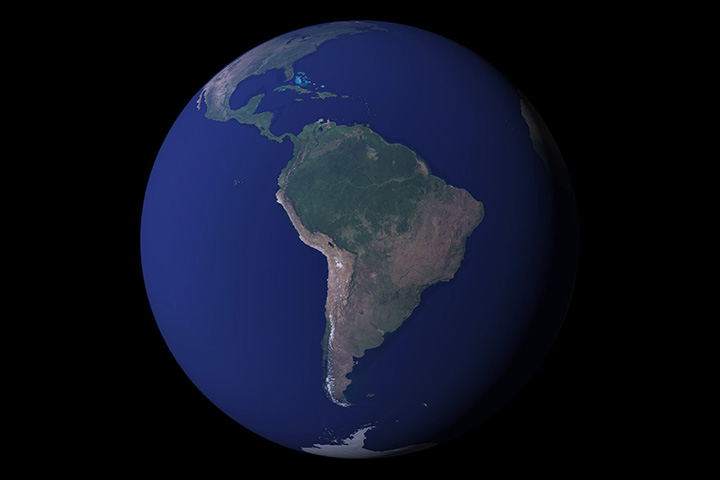
NASA satellites document how our world—forests, oceans, human landscapes, even the Sun—changes over months, seasons, and years.
Published Apr 29, 2009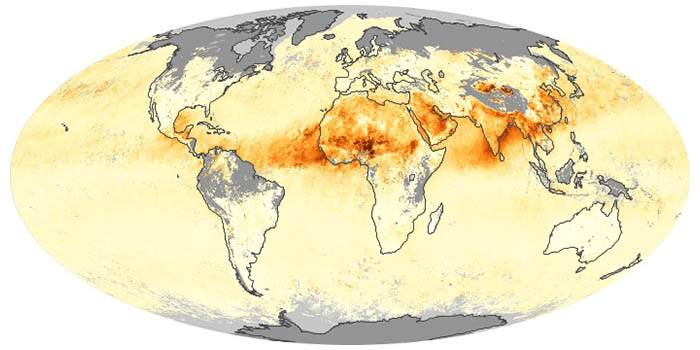
Airborne aerosols can cause or prevent cloud formation and harm human health. These maps depict aerosol concentrations in the air based on how the tiny particles reflect or absorb visible and infrared light.
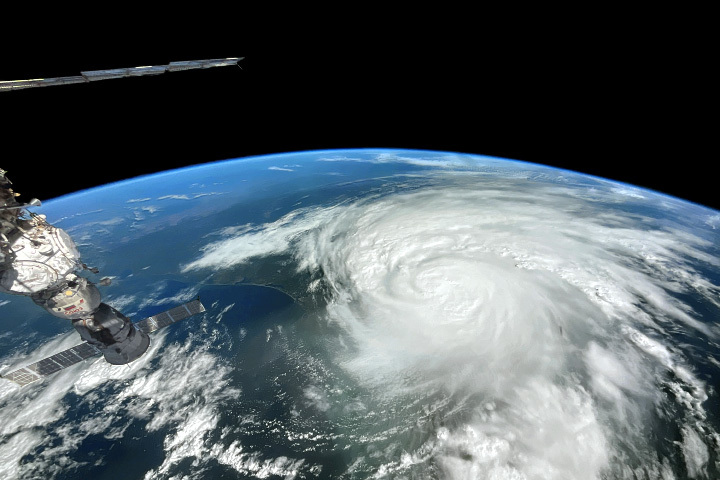
The 2023 season runs from June 1 to November 30, with peak activity generally occurring in September.
Published Jun 1, 2023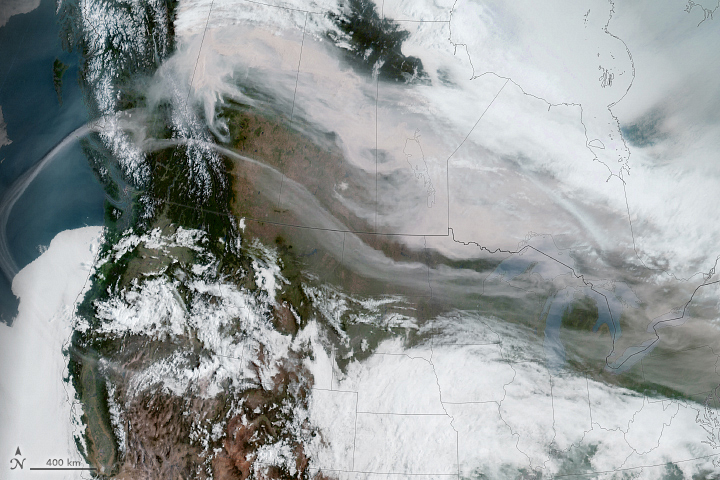
Wildland fires in 2023 brought hazy skies and poor air quality to several countries north of the equator.
Published May 22, 2023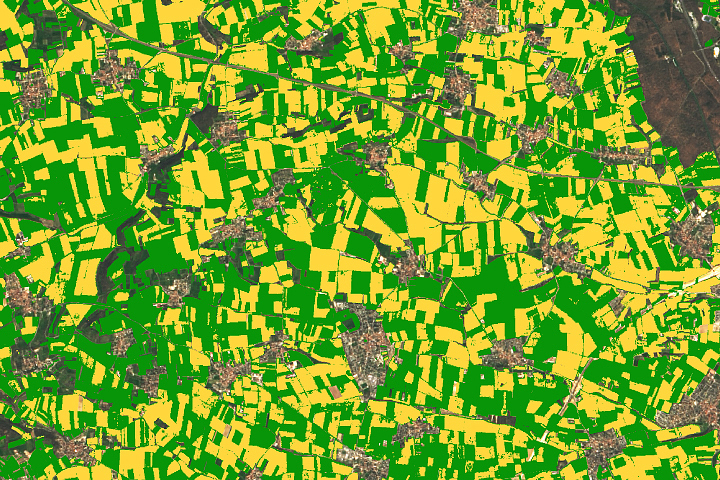
From soil conditions to crop productivity, satellite data help inform farmers, scientists, and decision-makers in the U.S. and around the world.
Published Feb 28, 2023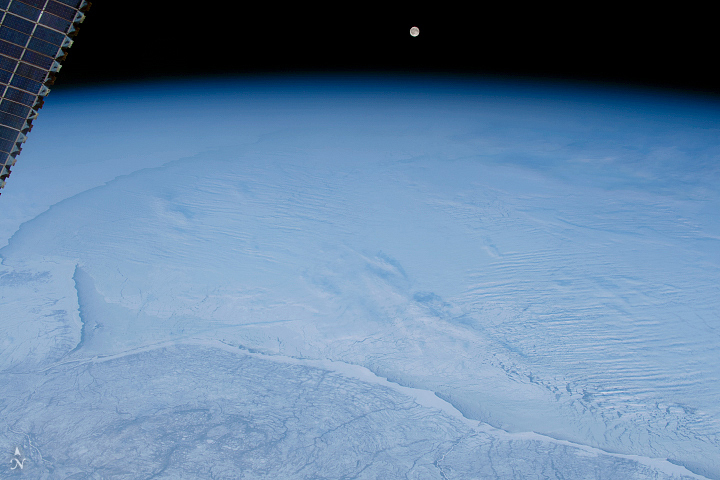
Over the years, astronauts aboard the orbiting laboratory have snapped spectacular photographs of Earth’s snow and ice in both hemispheres.
Published Dec 21, 2022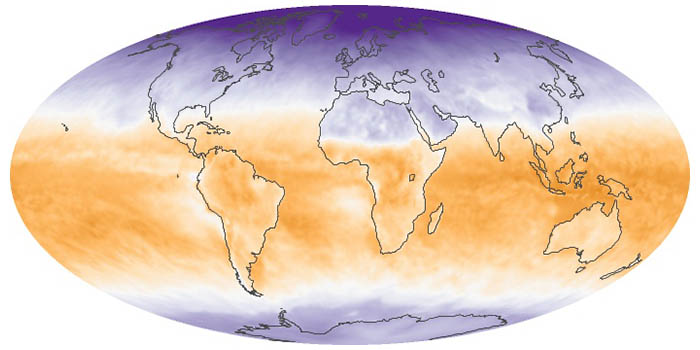
Net radiation is the balance between incoming and outgoing energy at the top of the atmosphere. It is the total energy available to influence climate after light and heat are reflected, absorbed, or emitted by clouds and land.
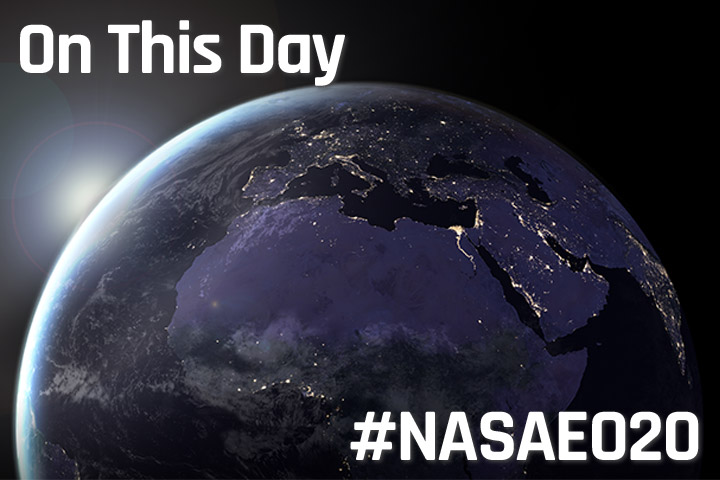
In honor of our site anniversary, we offer a selection of some of the most beautiful, newsworthy, interesting, and scientifically important images from 23 years online — one image for each day of the calendar year.
Published Apr 26, 2022Have you ever wondered what it would be like to live in a different part of the world? What would the weather be like? What kinds of animals would you see? Which plants live there? By investigating these questions, you are learning about biomes.
Published Aug 28, 2020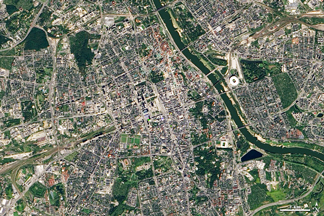
What do you do when presented with a new satellite image? Here's what the Earth Observatory team does to understand the view.
Published Nov 18, 2013