For more than two decades, NASA’s Terra satellite has measured atmospheric concentrations of carbon monoxide (CO). The good news is that average levels of the toxic air pollutant have dropped by about 15 percent since 2000. However, the rate of decline has slowed, falling from about 1 percent per year in the earlier part of the record to about 0.5 percent per year in the later years.
“We’ve seen carbon monoxide levels drop because cleaner-burning technologies are much more common now in the United States, Western Europe, and Eastern China due to stricter air quality standards,” explained Rebecca Buchholz, an atmospheric scientist at the U.S. National Center for Atmospheric Research (NCAR). “We’ve also seen a reduction in fires and burned area in the tropics.” The research findings were published in Remote Sensing of the Environment.
Deciphering the reasons for declining carbon monoxide levels was complicated for Buchholz and colleagues because there are several sources of the pollutant. The burning of carbon-based fuel of any type—including coal, gasoline, oil, natural gas, and wood—can emit CO. As a result, many common technologies (combustion engines, blast furnaces, and fireplaces) are all potential sources of it. Outdoor fires—both wildfires and agricultural fires—are also major sources of the pollutant. Finally, there are natural sources, such as emissions from certain plants that react with the atmosphere to produce the gas. Volcanoes and decomposing organic matter in rivers and oceans are also minor sources.
Carbon monoxide is also a long-lived gas, often persisting in the atmosphere for around two months. That means it has plenty of time to spread out and mix in the air, which makes it harder for atmospheric scientists to pinpoint sources of the gas and understand what factors are contributing to its decline.
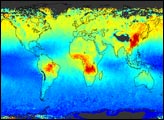
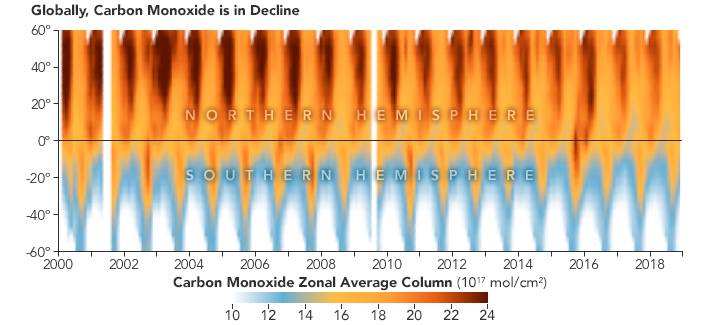
However, the overall trends are clear. The figures on this page help illustrate how carbon monoxide concentrations have varied during the past two decades. The image above highlights the seasonal and geographic variation in atmospheric carbon monoxide as measured by Measurement of Pollution in the Troposphere (MOPITT) between 2000 and 2019. The seasonal peaks in the spring in both hemispheres are driven by changes in the availability of sunlight and hydroxyl radical (OH), a “detergent” molecule that removes carbon monoxide from the atmosphere by converting it into carbon dioxide. The reduction in light in winter reduces the amount of hydroxyl in the air, which allows levels of carbon monoxide to increase in the winter and early spring. Across the entire year, carbon monoxide levels are higher in the Northern Hemisphere, where there are more landmasses, people, and fires than in the Southern Hemisphere. (The white gaps in the top plot are time periods when there was no available data.)Note how the seasonal spike in the Northern Hemisphere grows smaller and smaller toward the end of the record, a sign of cleaner skies and falling levels of the pollutant. A few outlier years do stand out. In 2002-2003, extreme fire activity in western and southeastern Russia dramatically increased levels of carbon monoxide in the Northern Hemisphere. Likewise, an El-Niño driven drought produced a record-breaking Indonesian fire season in 2015.
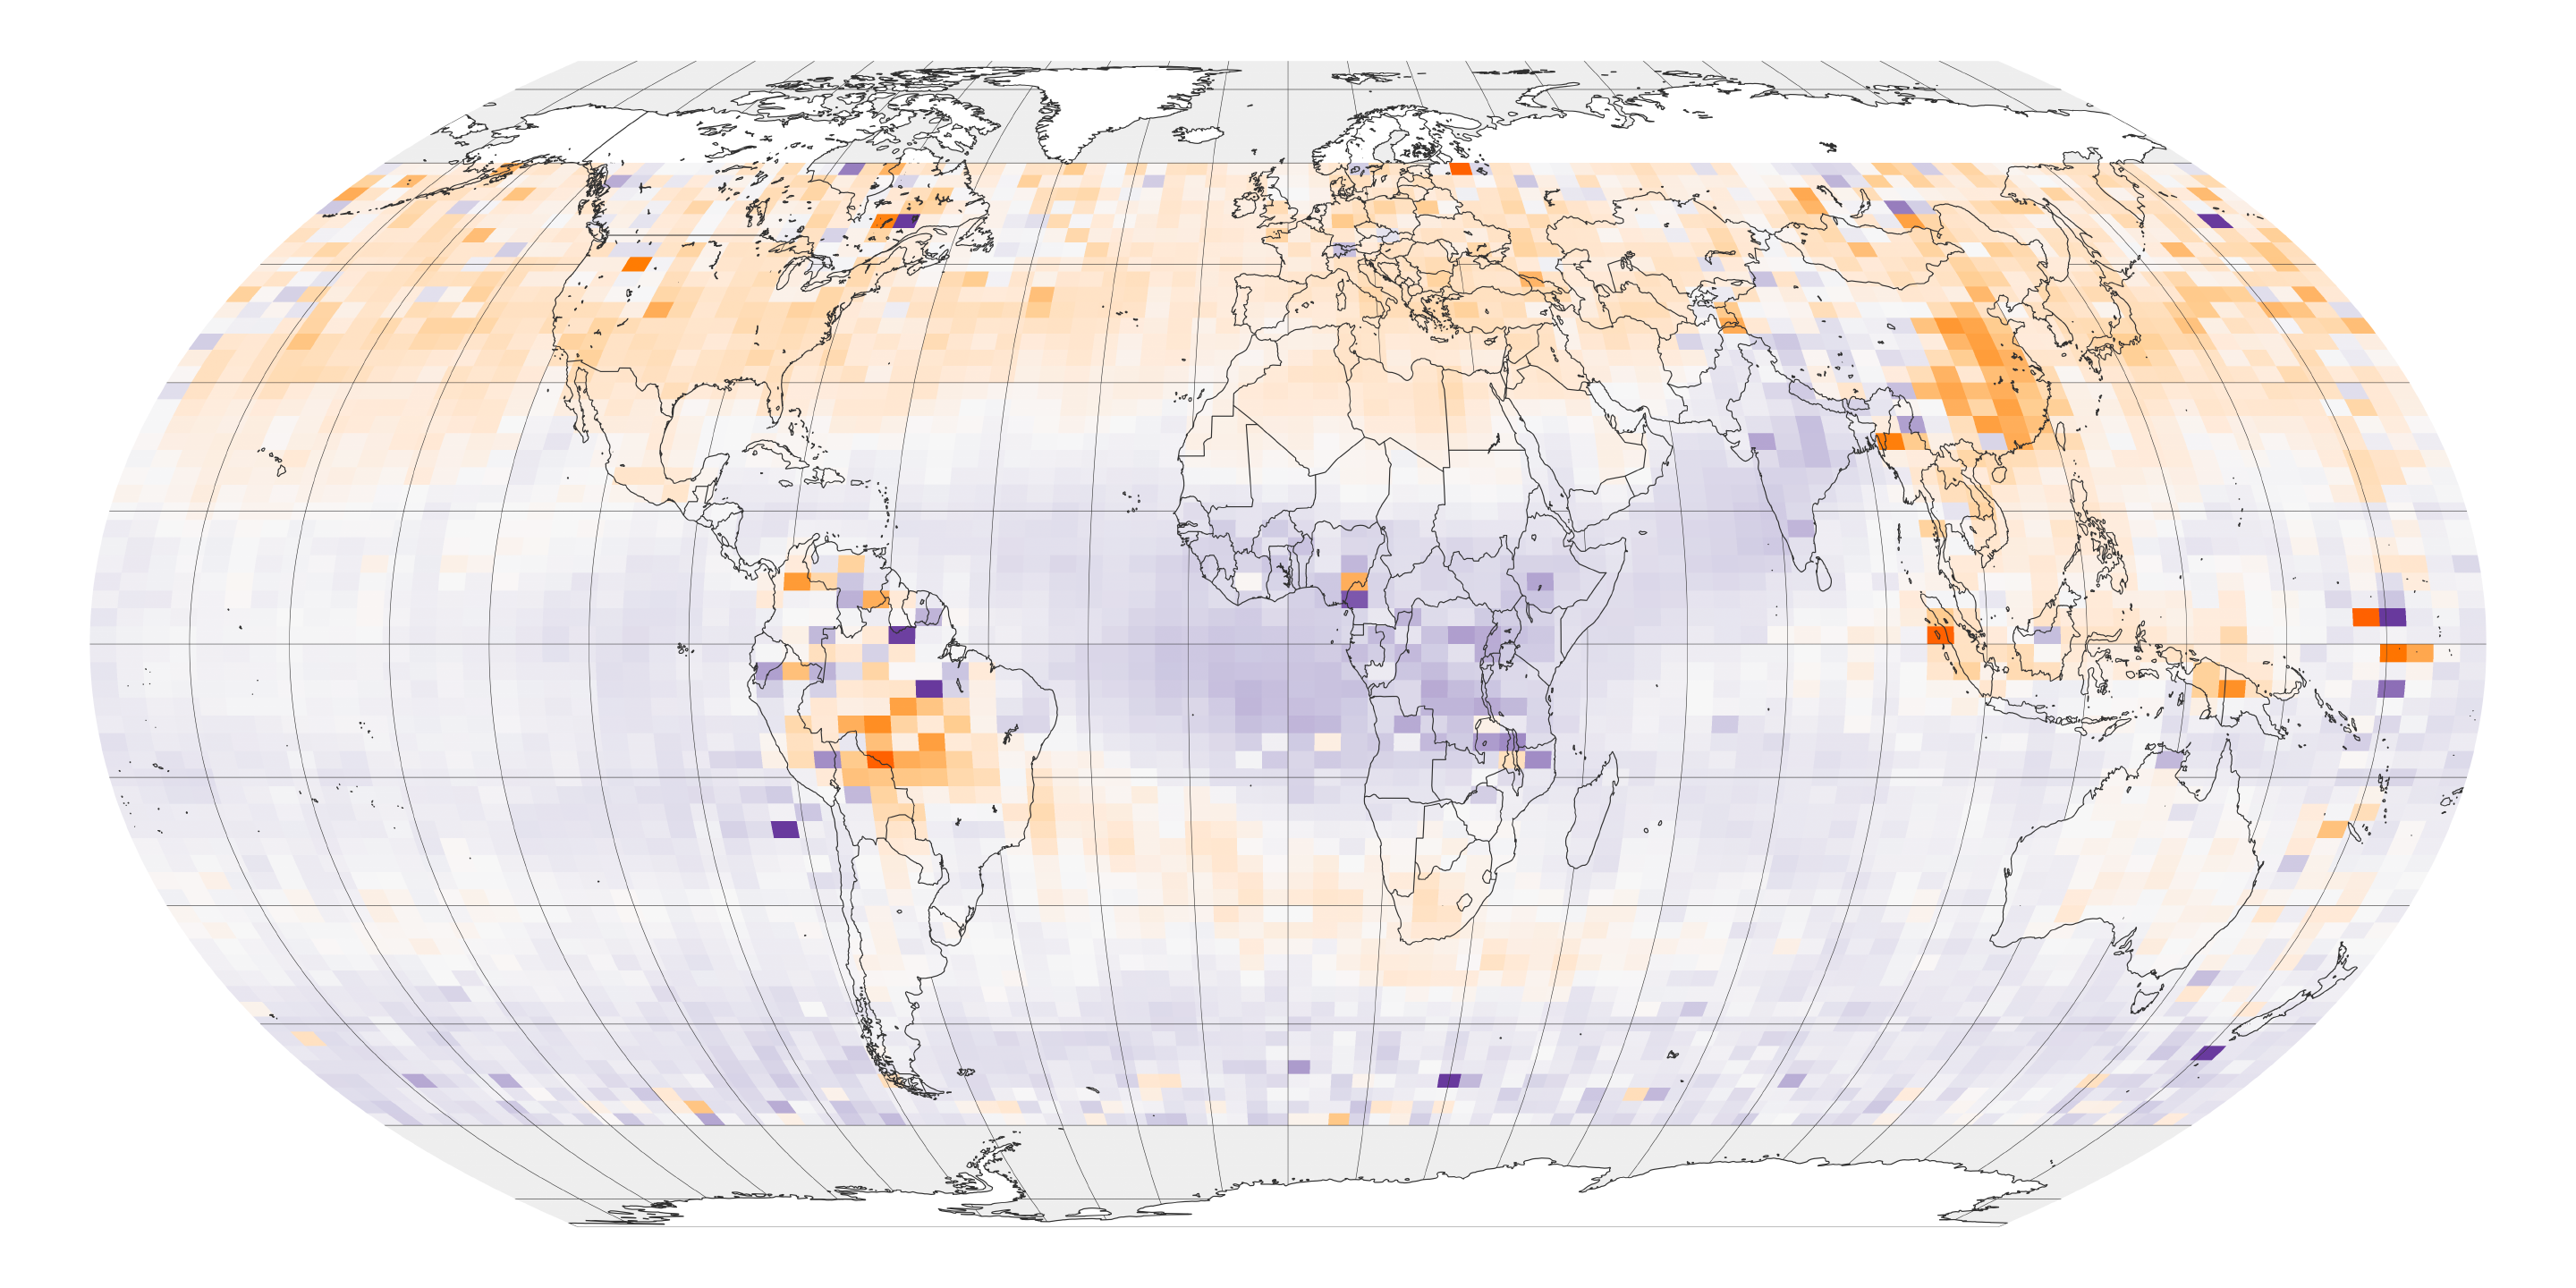
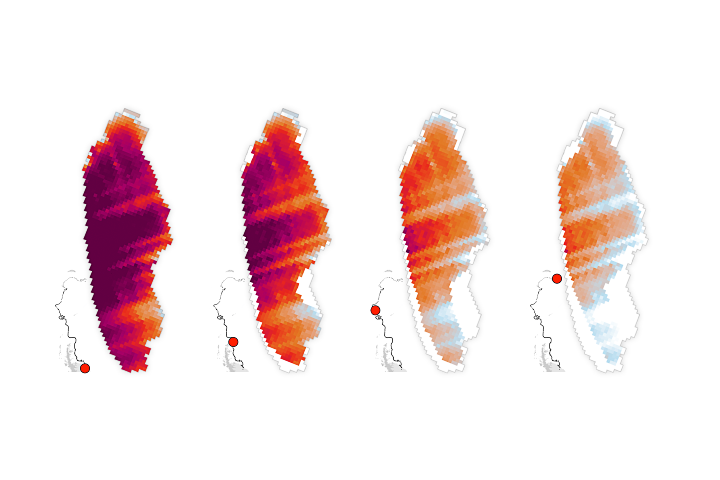
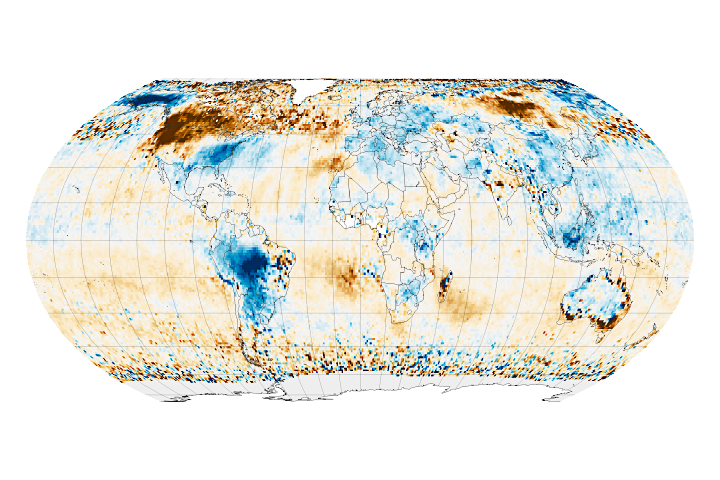
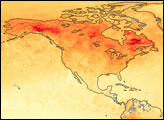
The second image shows the residual trends—where carbon monoxide concentrations are decreasing faster (orange) or slower (blue) than the global average since 2002. “Eastern China has seen carbon monoxide concentrations drop faster than anywhere else in the world, a decline of about 1 percent per year,” explained Helen Worden, the U.S. principal investigator for MOPITT. “That’s largely due to a shift from people burning coal in their homes to using natural gas or electricity coming from power plants that produce other pollutants, but not very much carbon monoxide.”
In India, economic and population growth occurred without a widespread switch to cleaner technologies, thereby limiting progress on CO pollution. In Central Africa, a combination of urbanization and widespread burning for crops and other reasons may have limited the rate of decrease, explained Worden. In contrast to Central Africa, Maritime Southeast Asia has also seen declines, probably because of a trend toward less biomass burning in forests.
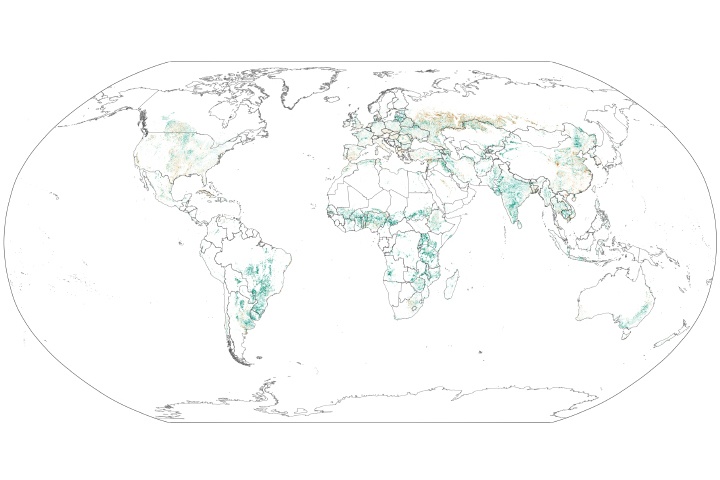
Biomass burning also declined in South America and likely contributed to the decline in carbon monoxide there. “However, deforestation and fires are rising again in Brazil after an earlier drop in the early 2000s,” said Worden. “It is possible that we’ll start to see carbon monoxide rebound in that region when we update the analysis to include more recent data.”
The changes over the ocean are likely the result of processes happening over the land before carbon monoxide was carried over the oceans by wind. “Oceans are quite a minor source compared to other natural and anthropogenic sources,” said Worden.
Editor’s Note: Read more about aerosol trends in tomorrow’s Image of the Day.
NASA Earth Observatory images by Joshua Stevens, using data courtesy of Buchholz, R., et al. (2021). Story by Adam Voiland.