Heavy snowfall in the Rocky Mountains in the winter and spring of 2019 provided a much-needed pulse of meltwater into Lake Powell, the second largest reservoir (by maximum water capacity) in the United States. Still, the effects of long-term droughts and rising air temperatures, combined with increasing demands for water in the American Southwest, mean the lake is still nowhere near its highs from the 1980s and 90s.
Lake Powell stretches across southeastern Utah and northeastern Arizona. Water managers first started filling the reservoir in 1963, when the Glen Canyon Dam was completed along the Colorado River. By the mid-1980s, the lake approached its full capacity. Water levels dropped due to drought and then rose again in the late 1990s. Lake levels have been mostly dropping over the past 20 years, punctuated by a few strong water years like 2019.
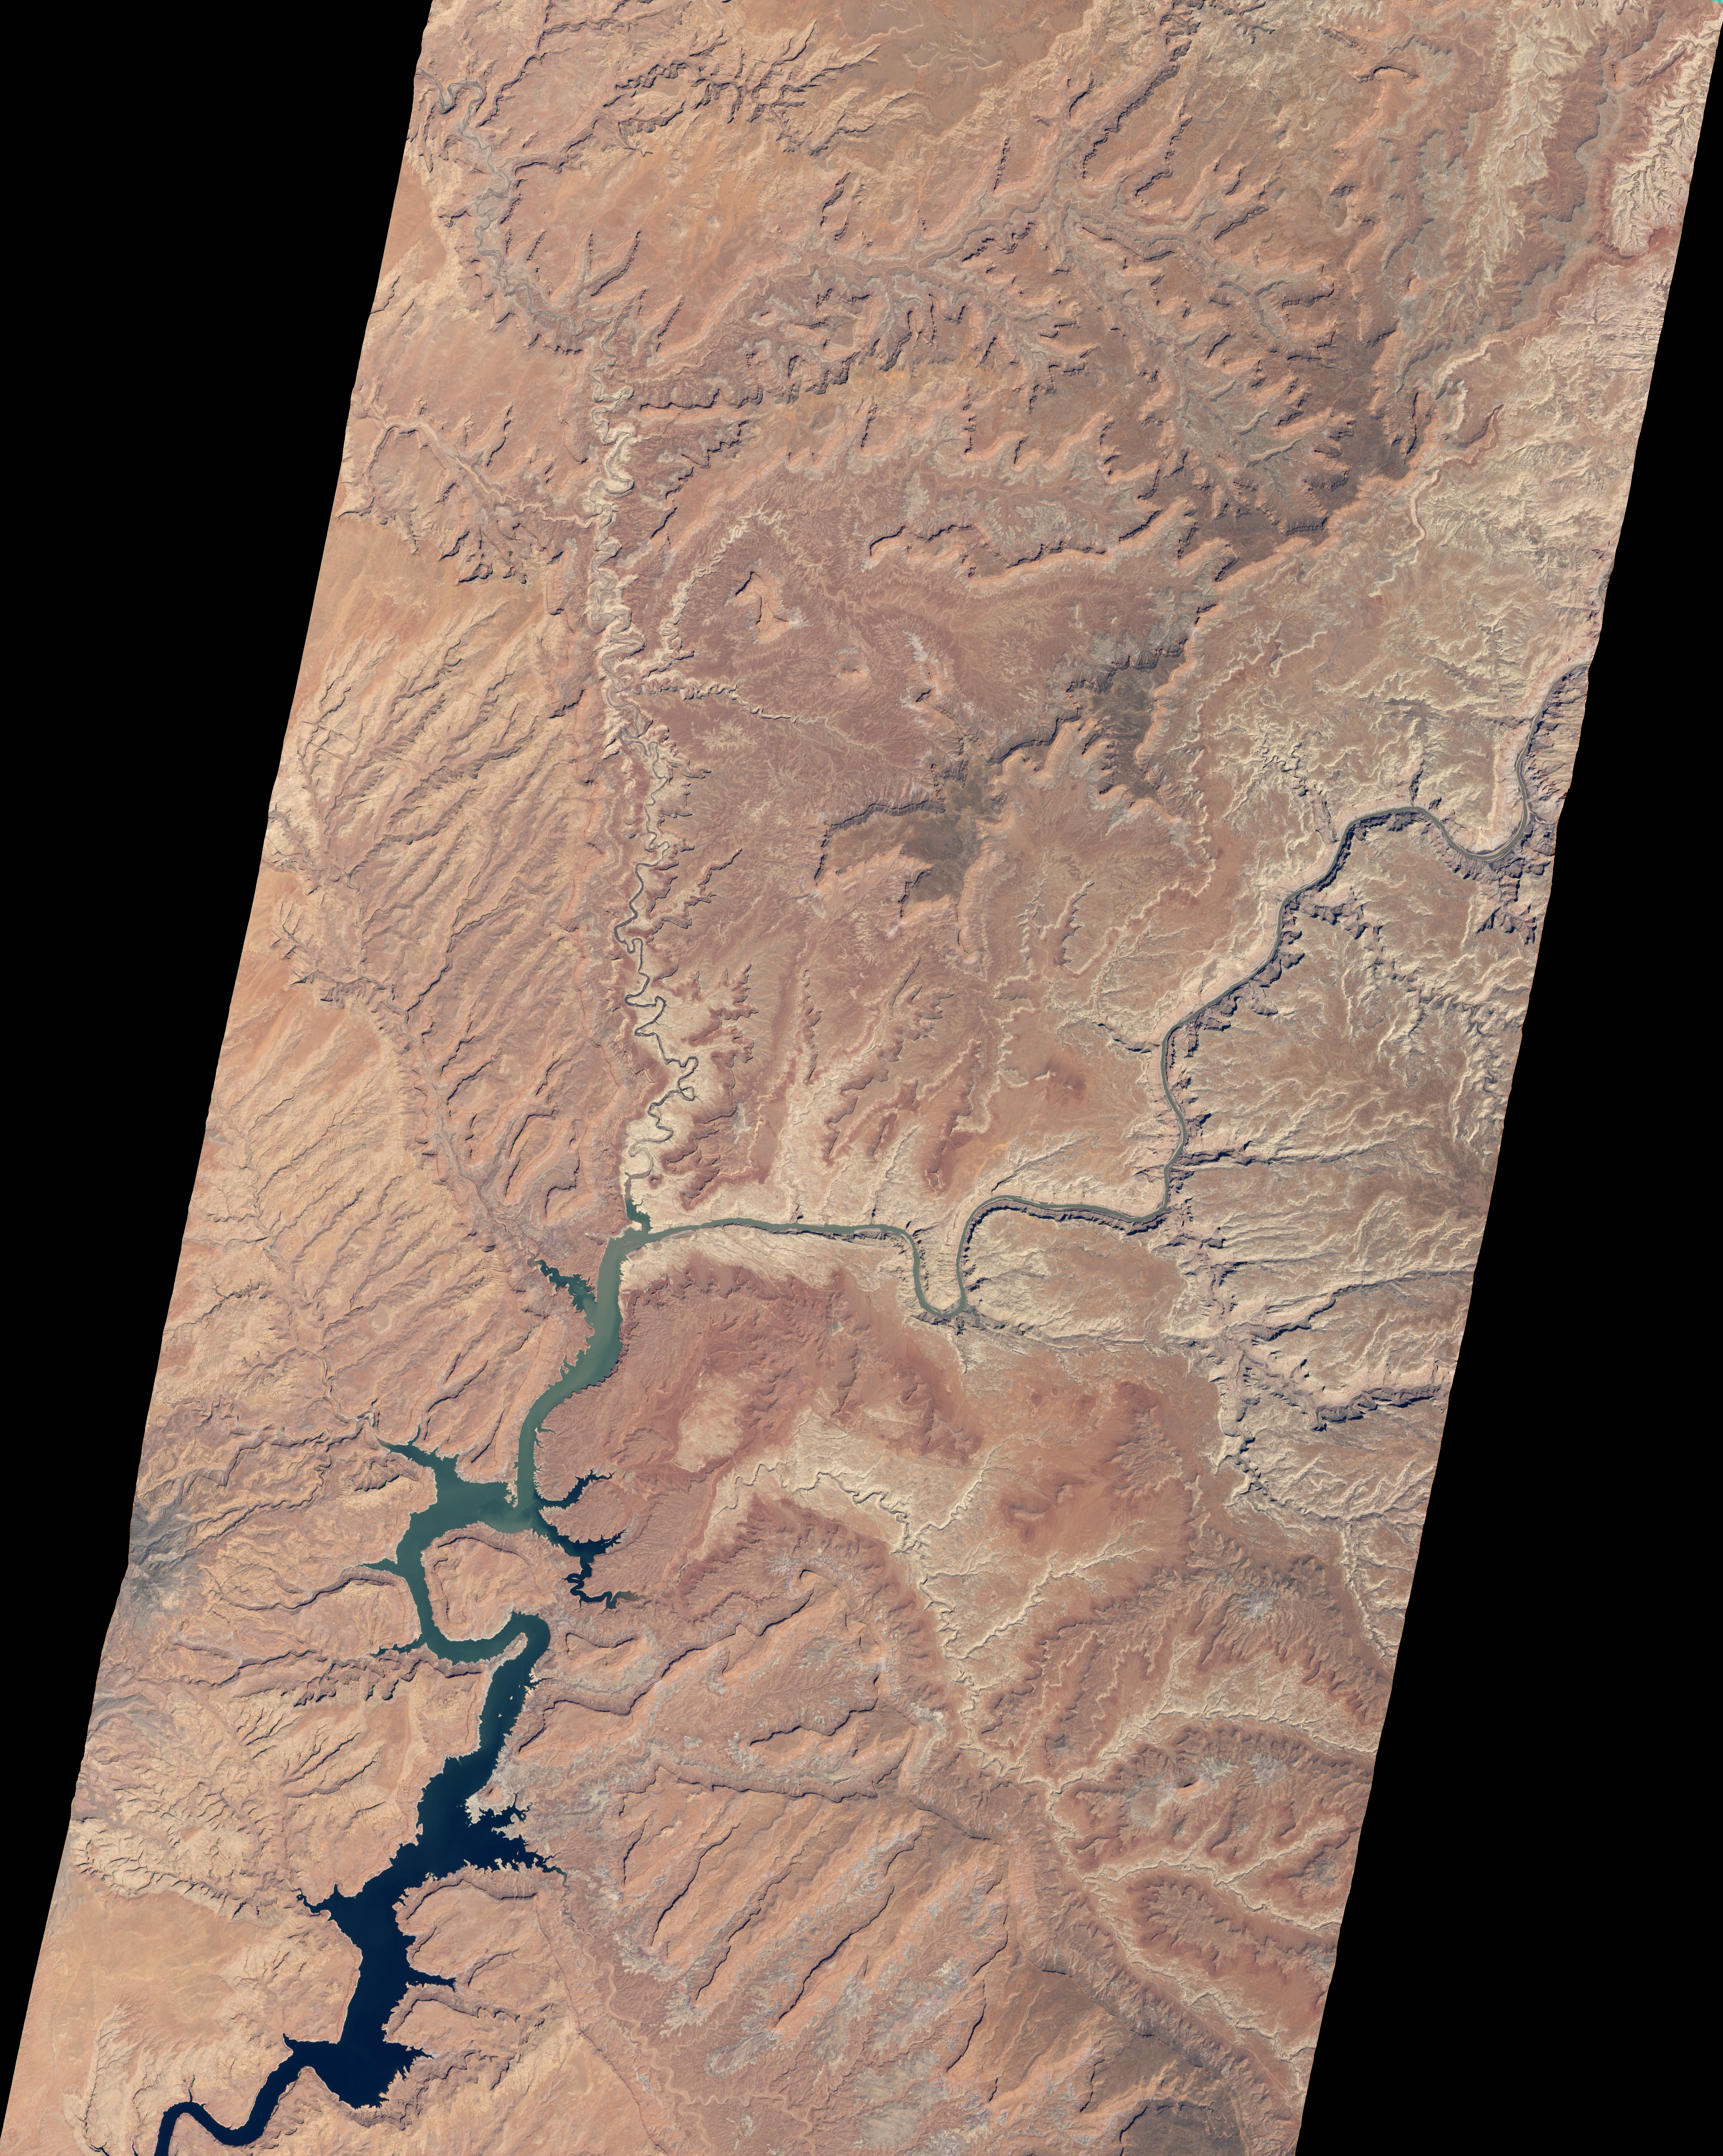
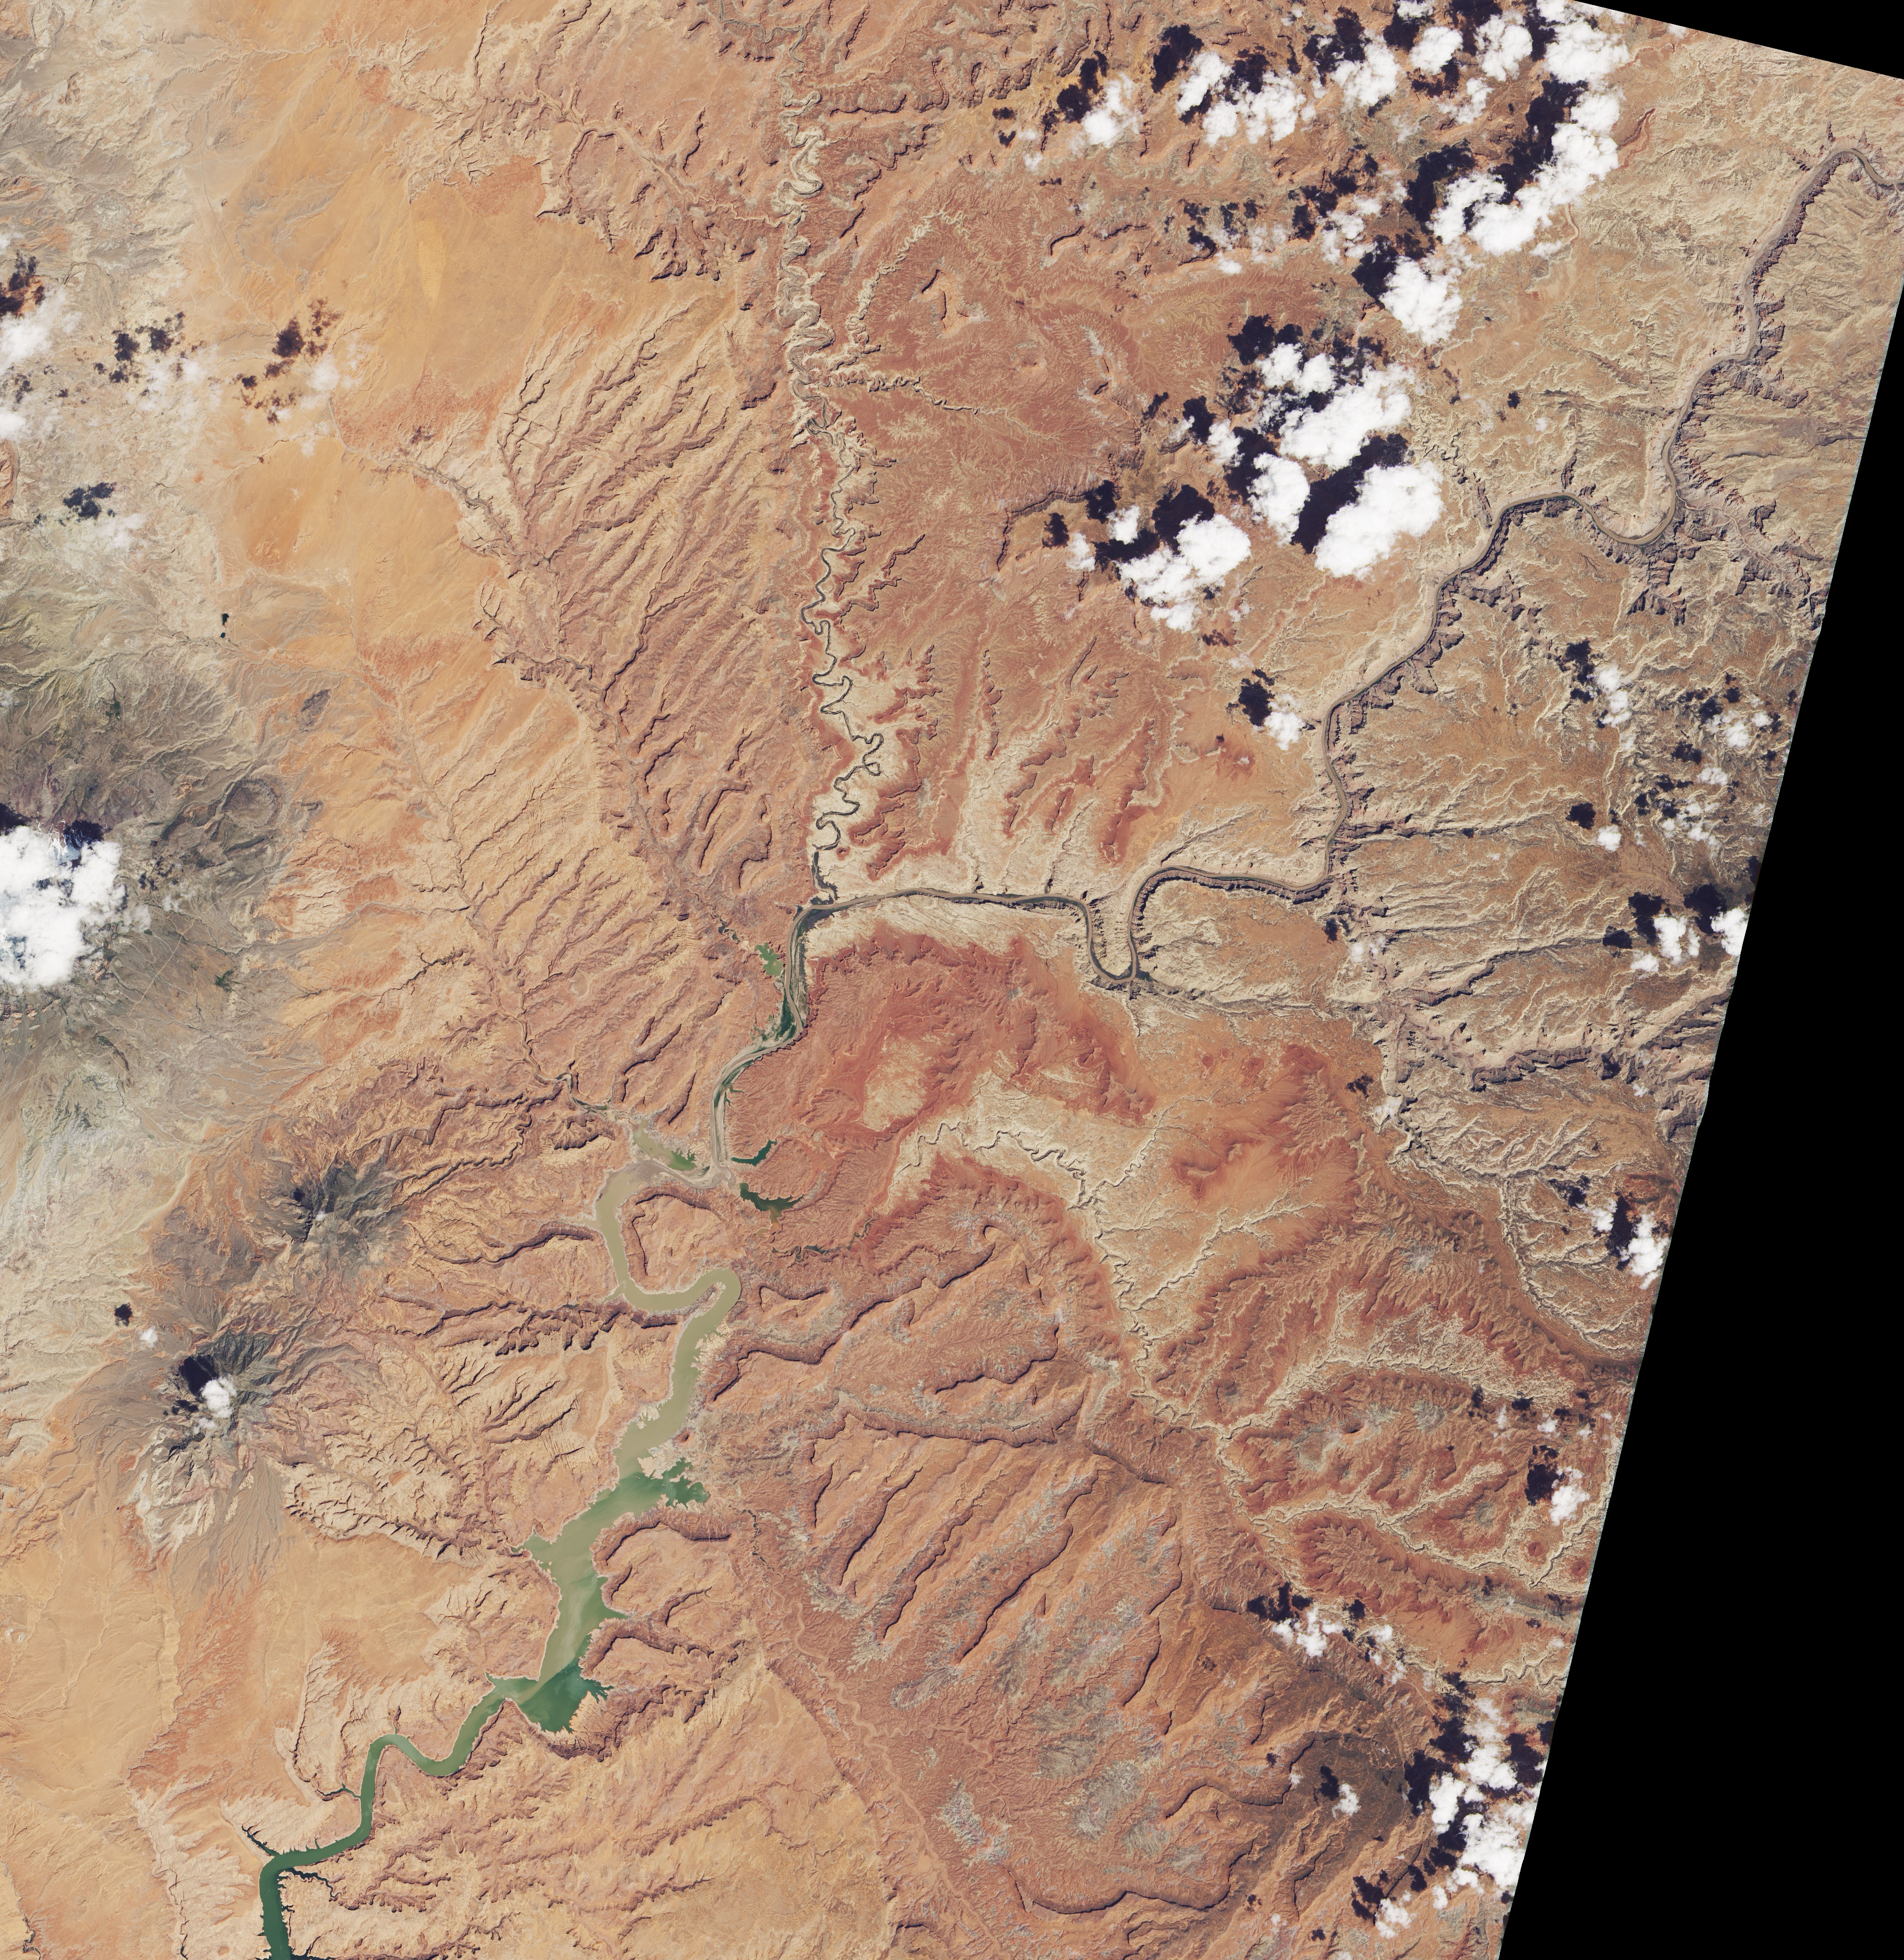
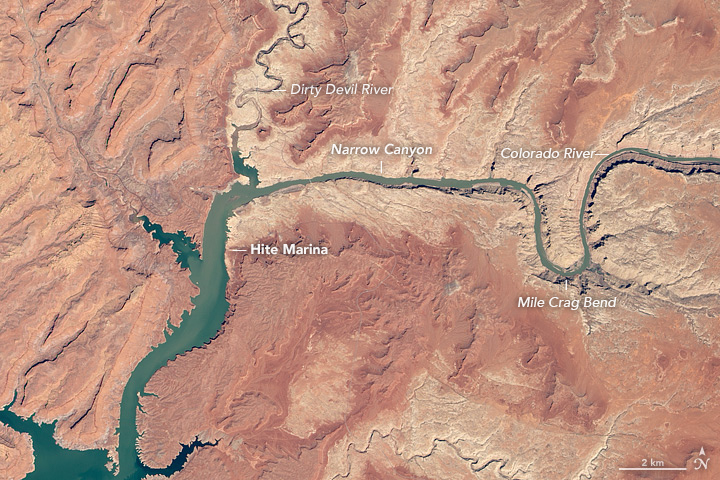
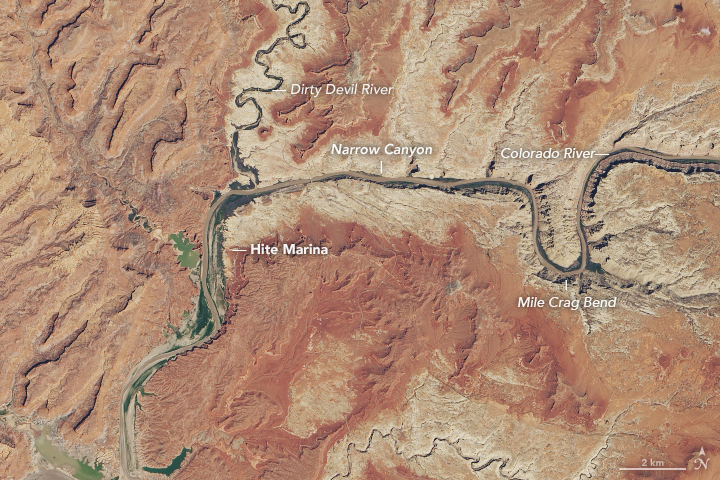
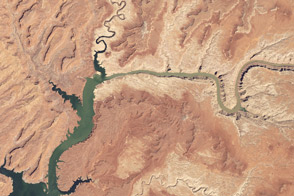
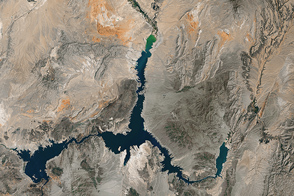
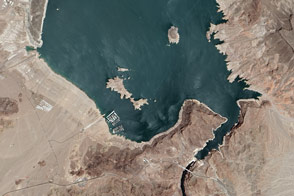
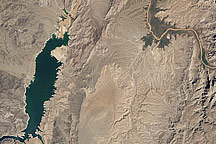
The images above, which also appear in our World of Change series, show Lake Powell in 2012 and 2019. The first (left) image was acquired by the Thematic Mapper on the Landsat 5 satellite on April 20, 2012, when then lake was near its highest spring level since 2000 because of an abundance of precipitation in 2011. The second image was acquired by the Operational Land Imager on Landsat 8 on May 2, 2019. A third image (below) shows the lake on August 31, 2019, near its peak level this year.
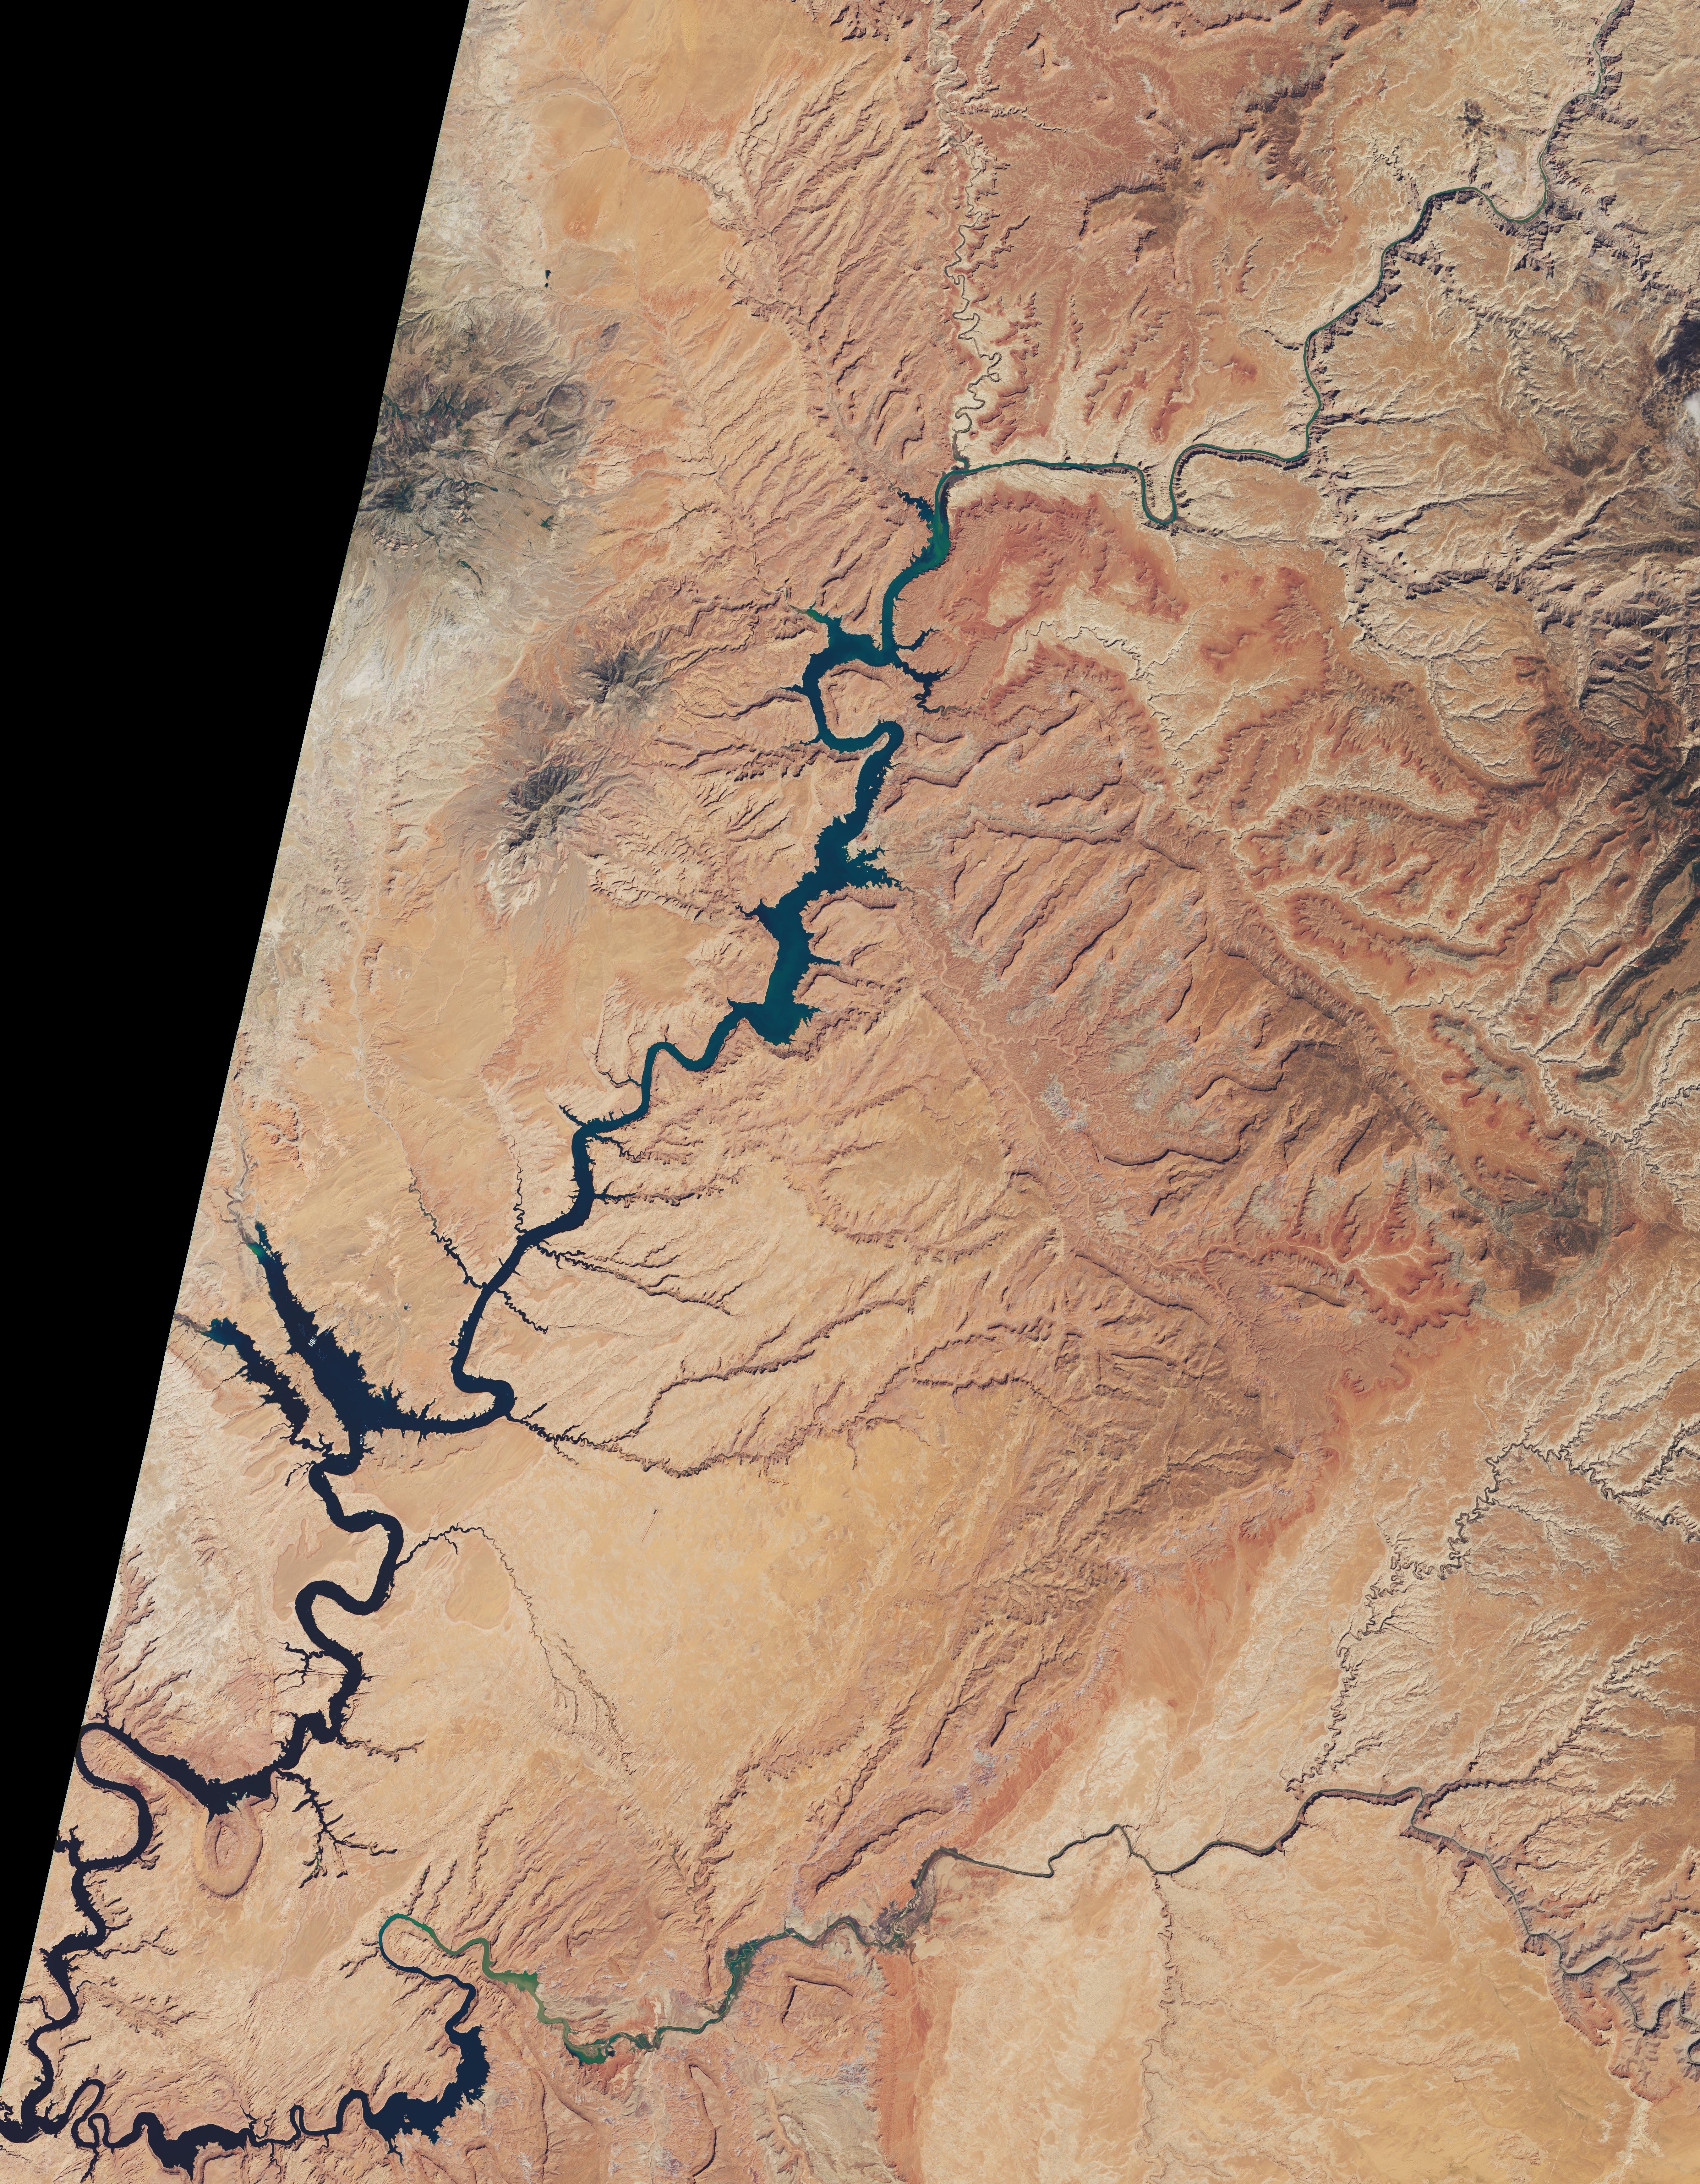
As of September 29, 2019, the water elevation level at Glen Canyon Dam was 3615.49 feet, and the lake stored 13.29 million acre-feet (maf) of water, about 55 percent of capacity and more than 100 feet below “full pool.” On May 1, 2019, before the abundant snow cover started melting, the lake stood at 3584.65 feet and held 10.34 million acre-feet of water. In May 2012 (comparison image), Lake Powell stood at 3636.83 feet and held 15.63 maf. (One acre-foot equals about 326,000 gallons.)
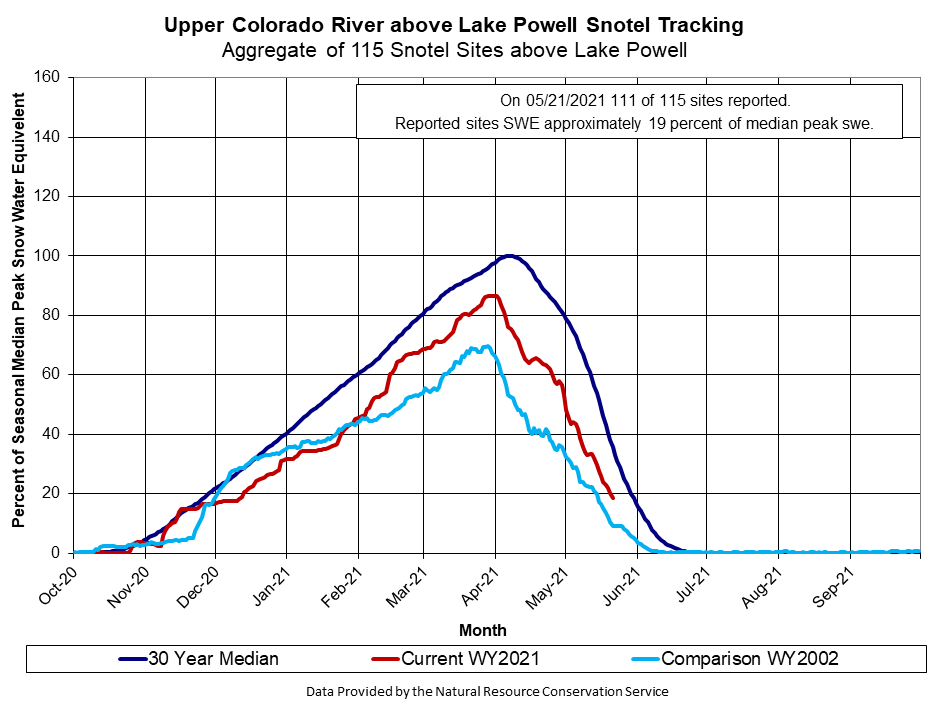
Snow came late in the 2018-19 winter, but when it arrived, it was heavy and frequent. Spring temperatures in the Rocky Mountains remained cooler than normal, keeping snow cover from melting quickly. A major snowfall in late June in Colorado raised snow water equivalents—a measure of the amount of water in the snowpack on the mountains—to 40 times the norm for June in the state. The Upper Colorado River basin as a whole reached snow water equivalent levels about 130 percent of the long-term median.
The abundance of snow in 2019 ended a severe drought that kept water flows into the river at 43 percent of normal in 2018. According to the Bureau of Reclamation (USBR), which manages Lake Powell, “the total water year 2019 unregulated inflow to Lake Powell is projected to be 13.19 million acre-feet (122 percent of average).”
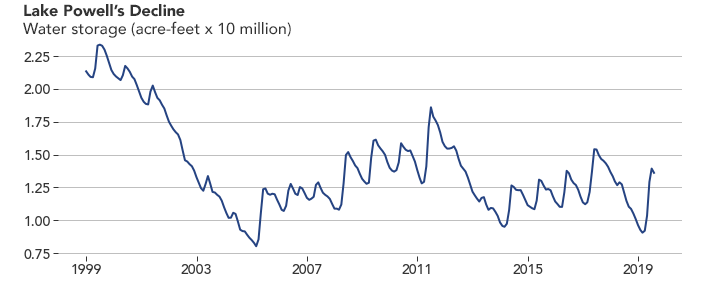
The boom in 2019 will help stabilize water storage in the lake. However, it will take several more years of abundant snow and rain to offset the steady decline since 1999, as shown in the graph above. Lake Powell was around 94 percent capacity in 2000. It sank to an all-time low in 2005.
USBR reported in September 2019: “During the 19-year period 2000 to 2018, the unregulated inflow to Lake Powell, which is a good measure of hydrologic conditions in the Colorado River Basin, was above average in only 4 out of the past 19 years. The period 2000-2018 is the lowest 19-year period since the closure of Glen Canyon Dam in 1963, with an average unregulated inflow of 8.54 maf, or 79 percent of the 30-year average (1981-2010). (For comparison, the 1981-2010 total water year average is 10.83 maf.)”
A century of river flow records and several centuries of tree-ring data show that there is some precedent for the dry years of the past few decades; extended droughts have been part of the long-term climate variability of the American Southwest. However, global warming is expected to make droughts more severe. For a long view, see the Earth Observatory feature World of Change: Water Level in Lake Powell, which documents changes in lake levels each spring since 1999.
NASA Earth Observatory images by Lauren Dauphin and Joshua Stevens, using Landsat data from the U.S. Geological Survey and water storage data from the Bureau of Reclamation. Story by Michael Carlowicz.


