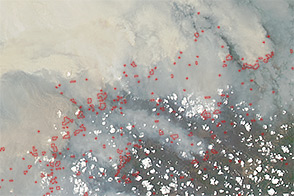
Scientists using NASA satellite data have found that droughts caused by the 1997-1998 El Niño—the most intense of the century—led to record numbers of fires. These, in turn, produced a record amount of smoke.
A team of researchers from Harvard University, Bryan Duncan, Randall Martin, Amanda Staudt, Rosemarie Yevich and Jennifer Logan, used data observed by NASA’s Total Ozone Mapping Spectrometer (TOMS) instruments to measure the amount of smoke pollution from biomass burning over 20 years. The team compared TOMS data with Scanning Radiometer and Sounder (ASTR) fire data from the European Space Agency’s European Remote Sensing-2 satellite.
Their research assessed the effects of the 1997-1998 El Niño events on global biomass burning. They concluded biomass burning around the world was unusually high during the 1997-1998 El Niño, greater than in any other period between 1979 and 2000. The amount of carbon monoxide emitted in 1997 and 1998 was about 30 percent higher than the amount emitted from worldwide motor vehicle and fossil fuel combustion.
“We found that fires typically produce the most pollution in Southeast Asia in March, in northern Africa in January and February, and in southern Africa and Brazil in August and September,” Logan said. During the El Niño of 1997-1998, Indonesia, Mexico, and Central America experienced extreme droughts, and forest fires raged out of control.
The smoke from the fires in Mexico and Central America was blown northward in May 1998, lowering air-quality and reducing visibility over much of the eastern United States. The fires in Indonesia burned tropical forests over an area equivalent to the size of southern New England and released enormous amounts of pollutants. The team estimated the Indonesian fires produced about 170 million metric tons of carbon monoxide, which equals about one-third of the carbon monoxide annually released from fossil fuels.
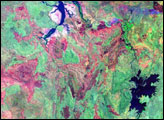
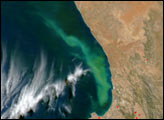
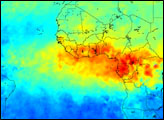
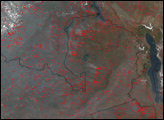
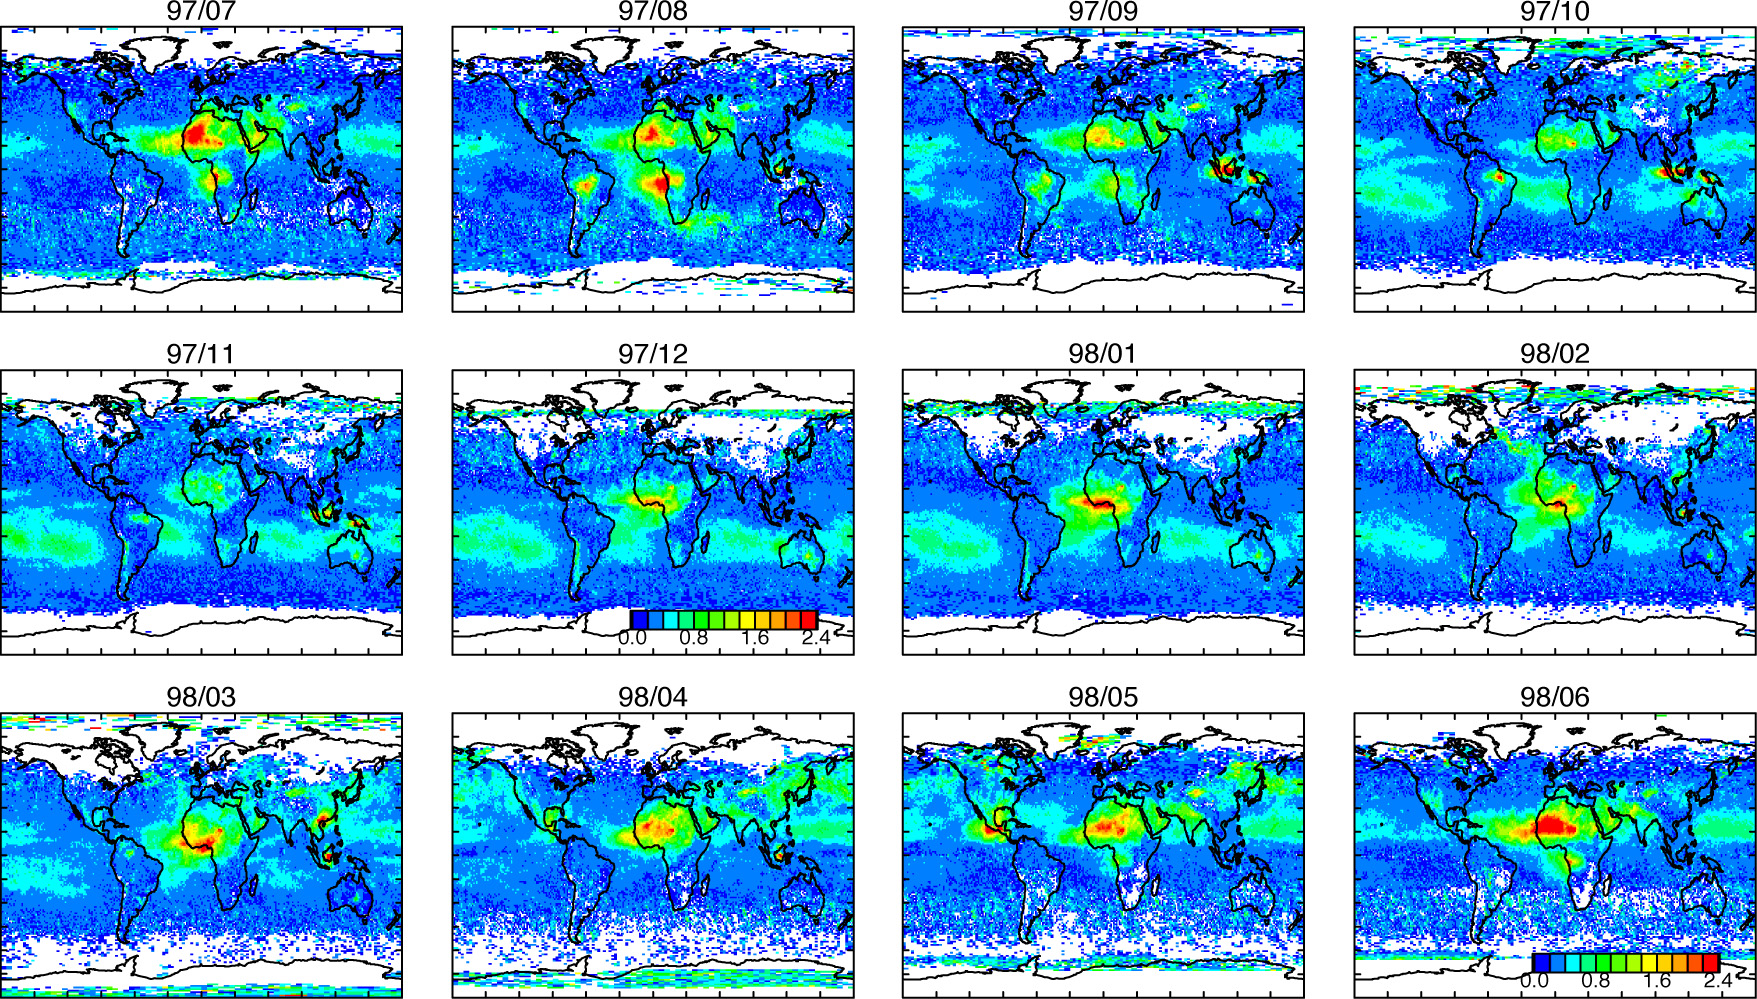
The images above show the amount of absorbing aerosols [tiny dark particles (like soot) suspended in the atmosphere] in the air around the world in 1997 and 1998. Blue colors indicates very little absorbing aerosols, and the orange and red colors indicate a high concentration of them. The aerosols over Indonesia were particularly thick during the wildfires that raged there during September and November 1997. Burning in Africa and Brazil also produced aerosols visible in these images. The high Aerosol Index values in Northern Africa are caused by dust blowing off the Sahara desert, and not fires.
For more information, read NASA Ties El Niño Induced Drought to Record Air Pollution From Fires .
Images courtesy Bryan Duncan (Swiss Federal Institute of Technology), based on data produced by the NASA TOMS Science Team