When Plants are Thriving |
|||
When it is thriving, land
vegetation can absorb vast amounts of carbon dioxide from the atmosphere
through the process of photosynthesis. Over a period ranging from
months to decades, however, the carbon stored in plants is released back
into the atmosphere through the processes of respiration, decomposition,
and fires, thus completing the carbon cycle. With their new data set,
the team wanted to gain new insights into where there are large
variations in plant growth because such variations have implications for
where and when vegetation serves as a source for carbon dioxide
(releasing it into the atmosphere) and when it is a sink (or absorbing
it). Additionally, they wanted to find out how these sources and sinks
change over time. Seasonal variations in plant growth can be quite
large, and plant growth can vary widely from one year to the next.
Moreover, recent studies suggest that, due to global warming, the
growing season is getting longer at higher latitudes, thereby increasing
the ability of terrestrial plants to serve as a carbon sink (Myneni et
al. 1997). |
Read "Measuring Vegetation (NDVI & EVI)" to learn how scientists use satellite data to monitor vegetation growth. | ||
To determine where and when plants are thriving, the team used AVHRR to measure Normalized Difference Vegetation Index (NDVI), which is basically an indication of how green a patch of land is. To derive NDVI, researchers must observe the distinct colors (wavelengths) of visible and near-infrared sunlight reflected by plants. As can be seen through a prism, many different wavelengths make up the spectrum of sunlight. When sunlight strikes an object, certain wavelengths of this spectrum are absorbed and other wavelengths are reflected. The pigment in plant leaves—chlorophyll—strongly absorbs visible light (from 0.4 to 0.7 µm) for use in photosynthesis. The cell structure of the leaves, on the other hand, strongly reflects near-infrared light (from 0.7 to 1.1 µm). The more leaves a plant has, the more these wavelengths of light are reflected and absorbed, respectively. (Click for more details on NDVI.) Los' team processed eighteen years of AVHRR data into a series of one-month global composite images of NDVI. From there, they were able to calculate the average greenness value for a given patch of land for a particular time of the year. Any significant departure from the average greenness value would then be an anomaly. Similarly, they used AVHRR data to calculate average global sea surface temperatures for any given patch of ocean for every month over the same 18-year time period. Again, any significant departure from average is termed an anomaly. When they put the two sets of measurements together into one continuous movie, Los' theory was confirmed—there is a clear and obvious relationship between sea surface temperature trends and terrestrial plant growth across the continents. "For the first time, we can see patterns of climate variability reflected in land vegetation growth, globally, which was not possible before," Los states. "Until now, we haven't had a good data set to show us how vegetation changes over long periods of time." |
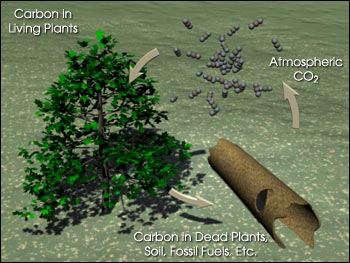
Carbon atoms move from the atmosphere to the biosphere (plant and animal life) and the lithosphere (the solid Earth) in a cycle that spans from months to decades. Plants "breathe" carbon dioxide, using the carbon to grow. When a plant dies (or its leaves fall off) the carbon dioxide is released back into the air as the organic material decays. Alternatively, the carbon may be buried and eventually become peat, coal, or oil. Image by Robert Simmon, NASA GSFC |