NASA and NOAA Missions for Monitoring Global Fires | |||
Different satellites provide observation and measurement capabilities for monitoring different fire characteristics: areas that are dry and susceptible to wildfire outbreak, actively flaming and smoldering fires, burned area, and smoke and trace gas emissions. Several satellite systems are currently available for fire monitoring with different capabilities in terms of spatial resolution, sensitivity, spectral bands, and times and frequencies of overpasses. Fires vary widely in size, duration, temperature, and in the tropics, where it is moist and humid, fires have a strong diurnal cycle. No one system provides optimal characteristics for fire monitoring—multi-sensor data fusion is needed to optimize the use of current systems.
Active fire mapping on a global scale using a single satellite system has been coordinated by the International Geosphere Biosphere Program (IGBP) using AVHRR data for 1992-93 from international ground stations. In addition, a small number of countries have developed their own regional AVHRR satellite fire monitoring systems using direct read-out; e.g., Brazil, Russia, and Senegal. Research groups have provided regional examples of trace gas and particulate emissions from fires for Brazil, Southern Africa, Alaska.
In late 1999, NASA launches the first in a series of new Earth remote sensors that will bring dramatically improved capabilities for global monitoring of fires. The Earth Observing System's flagship spacecraft—Terra (formerly named EOS AM-1)—will carry a payload of five sensors that, collectively, greatly expand scientists' capacity for near-real-time fire monitoring, while more accurately measuring emission products. The Terra spacecraft will fly in a near-polar orbit, crossing the equator in the morning when cloud cover is at a minimum and its view of the surface is least obstructed. Subsequently, in 2000, the Aqua (formerly EOS PM-1) spacecraft will launch into a near-polar orbit crossing the equator in the afternoon, to observe the daily variability of surface features. back: Aerosol Emissions
|
Global Fire Monitoring Related Case Studies
Related Data Sets
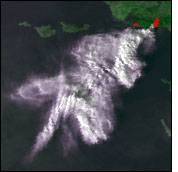
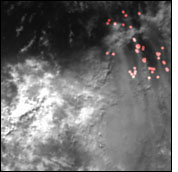
From Top: This fire occured in Laguna Beach, CA, near Los Angeles, on November 2, 1993. It was observed by the Advanced Very High Resolution Radiometer (AVHRR), flown on NOAA's polar orbiting weather satellites, which can detect the heat from fires in thermal infrared wavelengths, and can image smoke in visible and near infrared bands. (Image by Robert Simmon, NASA Goddard Space Flight Center, based on NOAA data) In May, June, and July, 1998, several fires burned out of control on the east coast of Florida. This image is from the Geostationary Operational Environmental Satellites, GOES-8. Like AVHRR, the instruments aboard NOAA's geostationary weather satellites detect fires and smoke in visible, near infrared, and thermal infrared wavelengths. Because the orbits of GOES satellites are synchronized with the Earth's rotation, they continuously view portions of the Earth's surface. (Image by Dennis Chesters, NASA Goddard Space Flight Center, based on NOAA data) The pink and yellow areas in this image are the remnants of fires - burn scars. This image was Landsat series satellites only pass over an area once every 14 days, so they are used to map the effects of fires, rather than their occurence and progress. (For more information about this image, see: Mapping Landcover and Fire Extent with Satellite Data.) (Image courtesy Dave Knapp) Particulates contained in smoke (aerosols) are difficult to measure from satellites, but recently NASA scientists used Total Ozone Mapping Spectrometer (TOMS) data to chart the spread of smoke from large fire outbreaks, such as those in Western Brazil during August, 1998. (Image by NASA Goddard Space Flight Center TOMS project) In the spring of 1998 drought conditions led to the spread of wildfires throughout Southeast Asia. The Island of Borneo was especially hard hit. This image from TRMM's Visible and Infrared Scanner (VIRS) shows fires (red) and smoke (mixed with clouds) from March 1, 1998. (Image by Greg Shirah, NASA Goddard Space Flight Center Scientific Visualization Studio) | ||

 Flown on
NOAA Polar Orbiting Environmental Satellites, the Advanced Very
High Resolution Radiometer (AVHRR) measures electromagnetic radiation
(light reflected and heat emitted) from our planet. AVHRR was originally
intended only as a meteorological satellite system but it does have
applications for fire monitoring. AVHRR remotely senses cloud cover and
sea surface temperature, enabling its visible and infrared detectors to
observe trends in vegetation, clouds, shorelines, lakes, snow and ice.
The visible bands can detect smoke plumes from fires as well as burn
scars. The thermal infrared band can detect actual hotspots and active
fires. Its ability to detect fires is greater at night, since the
system can confuse active fires with heated ground surfaces, such as beach
sand and asphalt.
Flown on
NOAA Polar Orbiting Environmental Satellites, the Advanced Very
High Resolution Radiometer (AVHRR) measures electromagnetic radiation
(light reflected and heat emitted) from our planet. AVHRR was originally
intended only as a meteorological satellite system but it does have
applications for fire monitoring. AVHRR remotely senses cloud cover and
sea surface temperature, enabling its visible and infrared detectors to
observe trends in vegetation, clouds, shorelines, lakes, snow and ice.
The visible bands can detect smoke plumes from fires as well as burn
scars. The thermal infrared band can detect actual hotspots and active
fires. Its ability to detect fires is greater at night, since the
system can confuse active fires with heated ground surfaces, such as beach
sand and asphalt.
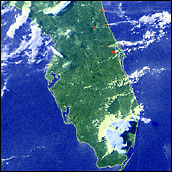 The
Geostationary Operational Environmental Satellites (GOES) house a
five-channel (one visible, four infrared) imaging radiometer designed to sense
radiant and solar reflected energy from sample areas of the Earth. They are
stationed in orbits that remain fixed over one spot on the equator, providing
continuous coverage of one hemisphere. GOES satellites aquire images every
15–30 minutes, at up to 1km resolution in visible light, for the detection
of smoke, and 4km resolution in thermal infrared to directly detect the heat of
fires.
The
Geostationary Operational Environmental Satellites (GOES) house a
five-channel (one visible, four infrared) imaging radiometer designed to sense
radiant and solar reflected energy from sample areas of the Earth. They are
stationed in orbits that remain fixed over one spot on the equator, providing
continuous coverage of one hemisphere. GOES satellites aquire images every
15–30 minutes, at up to 1km resolution in visible light, for the detection
of smoke, and 4km resolution in thermal infrared to directly detect the heat of
fires.
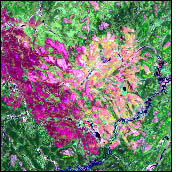 The Landsat
series of Earth-observing satellites monitor characteristics
and changes on the surface of the Earth at high resolution (up to 15m
per pixel). The original missions (1970s –
early 1980s) used the Multispectral Scanner (MSS) which was only
capable of detecting scars. Current Landsat series satellites use the
Thematic Mapper (TM) and Enhanced Thematic Mapper Plus (ETM+) to provide land surface information.
The seven bands (eight on Landsat 7's ETM+) monitor different types of Earth resources over a wide
area (81 North and 81 South Latitude). The thermal band enables the
system to detect "hotspots." Landsat 7 provides impressive high-resolution
images but only infrequently, revisiting an area every 14 days.
The Landsat
series of Earth-observing satellites monitor characteristics
and changes on the surface of the Earth at high resolution (up to 15m
per pixel). The original missions (1970s –
early 1980s) used the Multispectral Scanner (MSS) which was only
capable of detecting scars. Current Landsat series satellites use the
Thematic Mapper (TM) and Enhanced Thematic Mapper Plus (ETM+) to provide land surface information.
The seven bands (eight on Landsat 7's ETM+) monitor different types of Earth resources over a wide
area (81 North and 81 South Latitude). The thermal band enables the
system to detect "hotspots." Landsat 7 provides impressive high-resolution
images but only infrequently, revisiting an area every 14 days.
 The
Total Ozone Mapping Spectrometer (TOMS) is a measuring device that
provides data regarding ozone levels. Measured in Dobson Units (DU),
TOMS produces a complete data set of daily ozone levels around the
world. This instrument is the first to show aerosols (airborne dust and
smoke particles) over land. It also provides the ability to distinguish aerosols
that absorb light from aerosols that reflect it. TOMS makes 35 measurements every 8
seconds, each covering 50-200 kilometers wide on the ground. Close to
200,000 daily measurements cover almost every spot on the Earth except
for areas near the poles. These data make it possible to observe a variety
of Earth events including forest fires, dust storms and biomass burning.
The
Total Ozone Mapping Spectrometer (TOMS) is a measuring device that
provides data regarding ozone levels. Measured in Dobson Units (DU),
TOMS produces a complete data set of daily ozone levels around the
world. This instrument is the first to show aerosols (airborne dust and
smoke particles) over land. It also provides the ability to distinguish aerosols
that absorb light from aerosols that reflect it. TOMS makes 35 measurements every 8
seconds, each covering 50-200 kilometers wide on the ground. Close to
200,000 daily measurements cover almost every spot on the Earth except
for areas near the poles. These data make it possible to observe a variety
of Earth events including forest fires, dust storms and biomass burning.
 The
Tropical Rainfall Measuring Mission (TRMM) carries a high-resolution
sensor similar to AVHRR, called the Visible and Infrared Scanner (VIRS),
which is capable of spotting active fires as well as evidence of burn scars.
It has five bands from visible to thermal infrared (.63–12µm) and
provides 2km resolution. TRMM's primary purpose is to measure rainfall
over both land and oceans from 30° South to 30° North
Latitude. TRMM is unique in that previous satellites tended to show the
tops of clouds whereas TRMM instrumentation allows a look into the cloud
itself. In addition to its other sensors, TRMM carries LIS, the Lightning
Imaging Sensor. LIS provides information on both cloud to cloud and cloud
to ground lightning strikes around the world. The imager is capable of locating
and detecting ninety percent of lightning strikes in the world. This
information can help identify areas that may be particularly susceptible
to wildfire outbreaks.
The
Tropical Rainfall Measuring Mission (TRMM) carries a high-resolution
sensor similar to AVHRR, called the Visible and Infrared Scanner (VIRS),
which is capable of spotting active fires as well as evidence of burn scars.
It has five bands from visible to thermal infrared (.63–12µm) and
provides 2km resolution. TRMM's primary purpose is to measure rainfall
over both land and oceans from 30° South to 30° North
Latitude. TRMM is unique in that previous satellites tended to show the
tops of clouds whereas TRMM instrumentation allows a look into the cloud
itself. In addition to its other sensors, TRMM carries LIS, the Lightning
Imaging Sensor. LIS provides information on both cloud to cloud and cloud
to ground lightning strikes around the world. The imager is capable of locating
and detecting ninety percent of lightning strikes in the world. This
information can help identify areas that may be particularly susceptible
to wildfire outbreaks.