The Story of Honeybees | |||
Europeans imported the honeybee along with most of our food crops when they came to America more than 400 years ago. As generalist pollinators that can feed from almost any flowering plant, honeybees are adaptable. Many escaped from their caretakers and set up residence in woods across the country. Whether the imports have been good or bad for native plants and pollinators in natural ecosystems isn’t settled, but when it comes to America’s agricultural productivity, it’s almost impossible to overestimate how dependent we have become on honeybees. Agriculture depends on managed honeybees not only because some crops, such as the 700,000 acres of almonds in California, can only be pollinated by honeybees, but also because our industrial-scale system of crop production hinges on huge numbers of pollinators being available in a very limited window of time, sometimes as short as a few days. |
|||
 | |||
“When you grow a large crop for agriculture, you might have hundreds acres of, say, cucumbers all being managed to bloom at the same time, to be harvested at the same time, for efficiency,” Esaias explains. That kind of uniformity isn’t natural for native pollinators, which need a diverse and season-long food supply. Scientists have shown that at farms surrounded by adequate natural vegetation, native pollinators alone seem to be able to provide pollination services even for “heavy demand” species such as watermelon. At most conventional farms, however, natural vegetation is too scarce and broad-spectrum insecticide use is too common to support populations of native pollinators that are large enough to service crops. “The only way for growers to ensure pollination is to have somebody bring in a colony of bees, 1 to 2 colonies per acre, and put them out in the field,” says Esaias. |
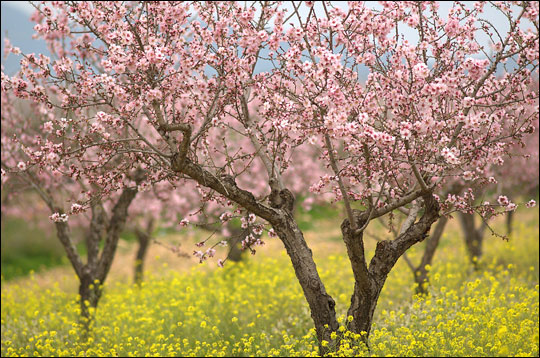
In the United States, agriculture depends on managed colonies of honeybees. Some crops, such as the almond trees pictured above, can only be pollinated by honeybees. Even managed colonies, however, depend on natural food sources like wildflowers and flowering trees to make enough honey to sustain the hive year-round. (Photograph ©2006 Trebol-a.) | ||
 | |||
A few stints pollinating watermelons over the course of a summer, however, isn’t enough to support a hive. From spring until fall, worker bees forage from dawn until twilight over a radius of up to about 5 kilometers from the hive, bringing back pollen and nectar from plants that are blooming. They turn the nectar into honey, which feeds the colony in the winter or when nectar and pollen are scarce. As the bees stockpile honey, the hive weight goes up. In Maryland, the primary nectar source for honeybees is flowering trees, namely tulip poplar, black locust, basswood, and holly. “During the peak of the nectar flow, a good, strong colony can gain 10 to 20 pounds in one day,” he says. “In Maryland, that goes on for a few weeks in late spring, and then, suddenly, it’s over.” For the remainder of the year, the weight of the hive dwindles as bees sustain themselves on the honey and pollen they have stockpiled during their three-to-four-week feeding frenzy. It was through this annual yo-yoing of weight gain and loss that Esaias’ bees began to tell him their story of climate change. |
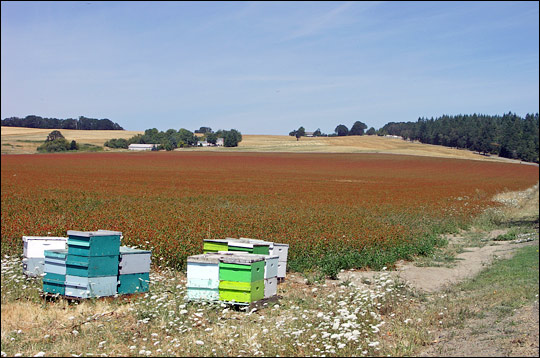
In the modern, industrial-scale system of agriculture, growers manage hundreds of acres of a single crop so that all the plants flower, ripen, and are ready to harvest at the same time. When farms are surrounded by abundant natural vegetation, native pollinators may be able to handle the workload, but more often, growers must hire a beekeeper to bring in hives by the truckload at flowering time. (Photograph ©2006 Dave Gilmore.) | ||
 |
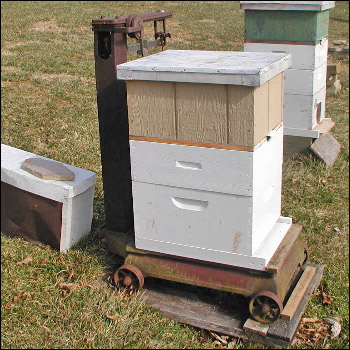
“In about 1990, my son was in Scouts,” he explained, “and the assistant scout master came to a meeting one night and said he’s leaving for a job out of state. He said, ‘I’ve got a problem. I’ve got three hives of bees, and I need somebody to take them. Who wants them?’ And my son said, ‘We’ll take ’em. Right, Dad?’” When they went to pick up the hives, the scout master pointed out a large rectangular scale, like the one a veterinarian would use for weighing your pet. “‘You better take that, too, he said,’” Esaias recalls. “Of course, at the time, I knew nothing about bees, so I didn’t really know what you want it for, but I took it.” It wasn’t until he was up to his ears in books on beekeeping that he realized what an important tool the scale was for keeping tabs on the health of the colony. |
In Maryland, honey production in a typical beehive ramps up for a few weeks in late spring when flowering trees such as tulip poplar and black locust start to bloom. The hive weight increases as bees produce honey, then tails off during the summer. (NASA graph by Robert Simmon, based on data from Wayne Esaias.) | |
“Based on the weight of the hive you can tell if you need to give them supplemental food, when the nectar is coming in the area, when to add supers [stackable chambers added to the top of the hive where the bees store extra honey], and when to harvest the honey,” he explains. Tending the bees and selling the honey became a family activity. Everyone took turns weighing the hive. As a field biologist who over the course of his career had found himself spending less and less time in the field, and more and more time in front of a computer analyzing satellite data, the hive monitoring was a real outlet for him. “Nearly every night in the spring and summer someone would go out weigh the hives,” he said. “And I guess just because I am a scientist, I started writing these things down. Even after my kids graduated and went off to school, I still kept the records. One day, I just decided to plot it all up [on a graph], just out of curiosity. And what I saw was that although you do see a lot of variability from year to year due to climate events, there was a very noticeable long-term trend, with flowering and nectar flows getting earlier and earlier in the year.” “Once I saw this trend, I wondered, well, how does what I see in my back yard compare with what other people have seen in this area? I found basically two datasets for comparison: one from 1922-23 in what is now downtown Chevy Chase, when it used to be a USDA agricultural research center; another study with hive weights was done by a researcher at the University of Maryland.” To compare his data to older records, he had to adjust for the difference in elevation; his home near Clarksville is in Maryland’s Piedmont, while the other locations were down on the coastal plain. “But once I adjusted for these regional differences based on elevation,” he said, “you see this dramatic advance in peak flowering time of almost a month.” Esaias scoured scientific books and papers for observations that could corroborate the story his bees were telling about how flowering times were changing in Maryland. He discovered that for several decades, Smithsonian botanist Stan Shetler had been keeping tracks of flowering dates for trees in and around Washington, D.C., based on calls from city residents that their backyard trees—including tulip poplar and black locust, two of the most important nectar producers in the state—were in bloom. Those records showed an advance in flowering (earlier blooming) beginning as far back as 1970. “My hive records don’t go back that far. They start in 1992,” says Esaias. “But what’s interesting is that when I project the trend I see in my data back in time, it seems like the changes in my area could have started in the mid-1980s, which is about 15 years later than the changes began in D.C. I wondered, why is that?” |
Hive weight is an important indicator of hive health. It tells a beekeeper when nectar is available in the area, when the bees need supplemental food, and when the keeper can harvest the honey. The seasonal pattern of weight gain and loss in a hive is different from ecosystem to ecosystem, but changes in the pattern in a particular location over time can be a sign that long-term climate change is influencing the plants in the region. (Photograph courtesy Wayne Esaias.) | ||
 |
Esaias thinks that urbanization is mostly responsible for the changes in flowering. Urbanization would also explain why flowering seems to have been affected earlier in D.C. than in his “backyard.” Urbanization creates a heat island, an area where surface temperatures are much higher than surrounding rural areas. Pavement, less soil moisture, air pollution, and heat generated by energy use conspire to raise the city temperatures as much as 10 degrees Fahrenheit (6 degrees Celsius) over surrounding areas. As cities get bigger, the urban heat island expands, too. As temperatures rise, spring comes earlier. Earlier leaf emergence and flowering have been observed in numerous cities across the world. “I am farther out from the city, and it took 15 years for the urban heat island effect to get here,” he concludes. Between urbanization and global warming from greenhouse gases, temperatures will continue to rise in coming years; the acceleration in flowering times that Esaias’ honeybees have documented so far may not be the end of the changes. |
Since the 1970s, Smithsonian botanists have kept track of Washington, D.C., residents’ reports of when their backyard trees first bloomed each spring. The dates vary from year to year depending on the weather, but on average, blooming is starting earlier. Dark purple diamonds represent overlapping flowering dates. (Graph by Robert Simmon, based on data from Abu-Asab et al.) | |
