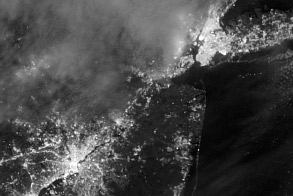
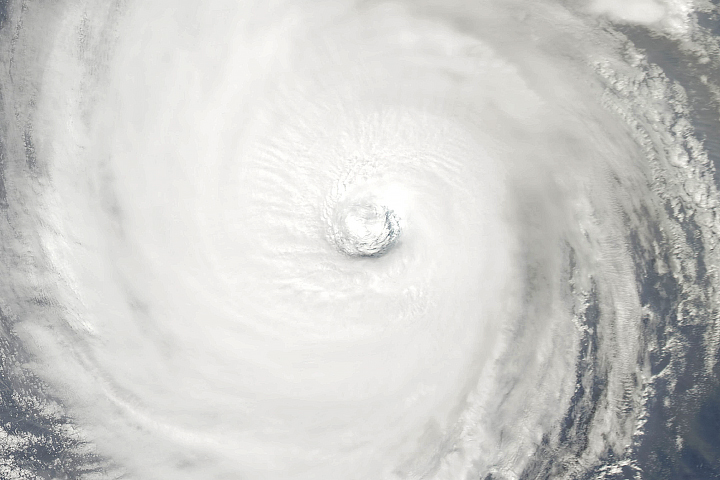
Satellite instruments captured numerous images of Hurricane Sandy—using both daylight and moonlight—as the enormous storm approached the heavily-populated East Coast of the United States in late October 2012. In most cases, these instruments observed just the uppermost layer of clouds at the top of the storm.
However, one satellite—Cloudsat—peered inside the storm and observed its vertical structure. It did so with a cloud-profiling radar that sent pulses of energy toward Earth and recorded the strength of the signal that bounced off ice and water particles.
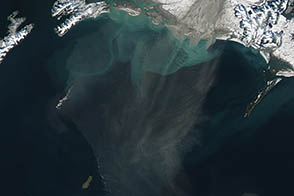
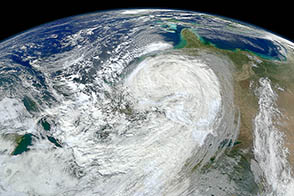
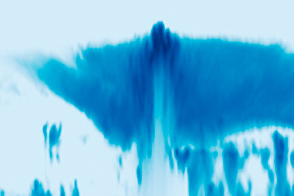
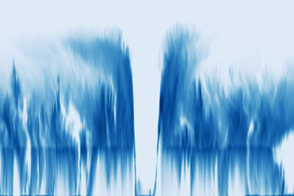
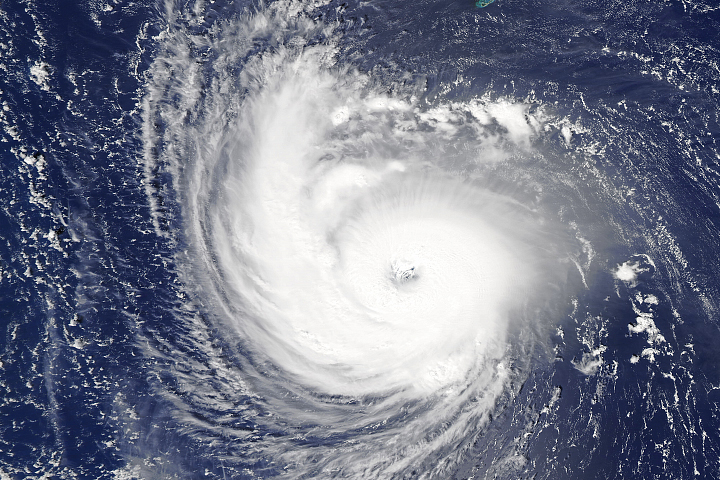
The bottom map shows the storm as observed by Cloudsat around 2 p.m. local time (18:00 Universal Time) on October 29, 2012. The image shows a cross-section—what the storm would look like if it had been sliced near the middle and viewed from the side. (Watch this animation to see how Cloudsat collects data). The top image, acquired the same day by the Moderate Resolution Imaging Spectroradiometer on the Aqua satellite, is shown for reference. The yellow line is the north-to-south track that CloudSat took over the storm.
In the Cloudsat data, the darkest blues represent areas where clouds and raindrops reflected the strongest signal back to the satellite radar. These areas had the heaviest precipitation and the largest water droplets. The blue line in the center of the image is the freezing line; ice particles formed above it, raindrops below it. Though they look similar from above, the thin clouds on the far left of the image at an altitude between about 6 and 10 kilometers (4 and 6 miles) are cirrus clouds producing little or no precipitation.
Another clue to the intensity and concentration of precipitation is visible at the bottom of the image. In areas with fewer clouds and less vigorous precipitation, enough radar signals made it all the way to the ground to create the blue line along the bottom. In areas with heavy precipitation, the line is absent because so much of the radar’s signal was scattered before reaching the ground.
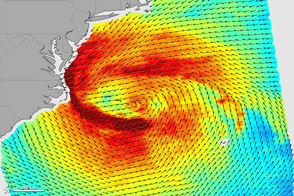
Sandy was an unusual hybrid storm that included features of both a tropical cyclone and an extratropical winter storm. The offshore tropical storm merged with a storm system approaching from the west, giving Sandy a cloud structure that was different than most hurricanes and typhoons.
Sandy’s clouds, for instance, reached about 10 kilometers (6 miles) at their highest point—not as high as the clouds of many tropical cyclones. For comparison, Hurricane Earl and Super Typhoon Choi-Wan’s both reached about 15 kilometers (9 miles).
Sandy’s cloud field was also unusually wide—about 1,200 kilometers (750 miles) from one end to the other—because the storm was in the process of becoming an extratropical cyclone. Tropical cyclones tend to have tight, circular cloud bands that are about 400 kilometers (250 miles) from edge to edge (or end to end). Extratropical cyclone bands often stretch more than 800 kilometers (500 miles).
Scientists are creating a database of Cloudsat overpasses in order to better understand how storms work. Natalie Tourville, a research meteorologist at Colorado State University who studies tropical cyclones, explained some of the ways that Cloudsat has proven useful since it launched in 2006.
“CloudSat is providing exceptional views of the internal structure of tropical cyclones, with at least 30 eye overpasses globally,” she said. “We’ve been able to sample eye wall slope and view the vertical details of the convective core regions. This includes where and how large these cores are and how high the cloud tops are. We've also sampled overshooting cloud tops (some extend over 17 kilometers into the atmosphere) and provide detailed analysis of exactly what is underneath the cirrus clouds of these storm systems.”
Scientists have also developed an innovative technique that uses Cloudsat measurements, in conjunction with data from other satellites, to estimate storm intensity—something that has proven challenging to do from space. A team of researchers first described the technique in an article published in IEEE Geoscience and Remote Sensing Letters in 2008. Tourville is currently working on a follow-up project that aims to improve the technique by using more recent Cloudsat data.
NASA Earth Observatory image by Jesse Allen, using CloudSat FirstLook data provided courtesy of the CloudSat team at Colorado State University. Caption by Adam Voiland.