

Carbon monoxide is perhaps best known for the lethal effects it can have in homes with faulty appliances and poor ventilation. In the United States, the colorless, odorless gas kills about 430 people each year.
However, the importance of carbon monoxide (CO) extends well beyond the indoor environment. Indoors or outdoors, the gas can disrupt the transport of oxygen by the blood, leading to heart and health problems. CO also contributes to the formation of ground-level ozone, another air pollutant with unhealthy effects. And though carbon monoxide does not cause climate change directly, its presence affects the abundance of greenhouse gases such as methane and carbon dioxide.
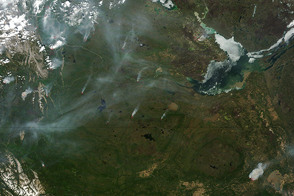
Carbon monoxide forms whenever carbon-based fuels—including coal, oil, natural gas, and wood—are burned. As a result, many human activities and inventions emit carbon monoxide, including: the combustion engines in cars, trucks, planes, ships, and other vehicles; the fires lit by farmers to clear forests or fields; and industrial processes that involve the combustion of fossil fuels. In addition, wildfires and volcanoes are natural sources of the gas.
Little was known about the global distribution of carbon monoxide until the launch of the Terra satellite in 1999. Terra carries a sensor—Measurements of Pollution in the Troposphere (MOPITT)—that can measure carbon monoxide in a consistent fashion on a global scale. With a swath width of 640 kilometers (400 miles), MOPITT scans the entire atmosphere of Earth every three days.
Since CO has a lifetime in the troposphere of about one month, it persists long enough to be transported long distances by winds, but not long enough to mix evenly throughout the atmosphere. As a result, MOPITT’s maps show significant geographic variability and seasonality. To view month by month maps of carbon monoxide, visit the carbon monoxide page in Earth Observatory’s global maps section.
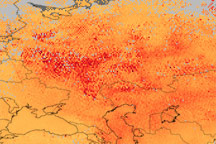
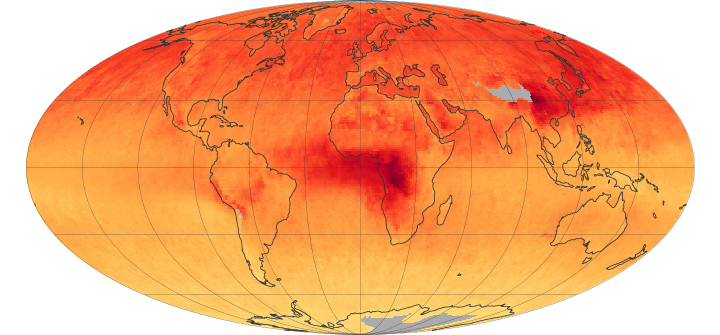
In Africa, for example, agricultural burning shifts north and south of the equator with the seasons, leading to seasonal shifts in carbon monoxide. Fires are also the dominant source of carbon monoxide pollution in South America and Australia. In the United States, Europe, and eastern Asia, the highest carbon monoxide concentrations occur around urban areas and tend to be a result of vehicle and industrial emissions. However, wildfires burning over large areas in North America, Russia, and China also can be an important source.
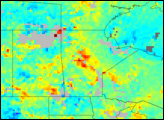
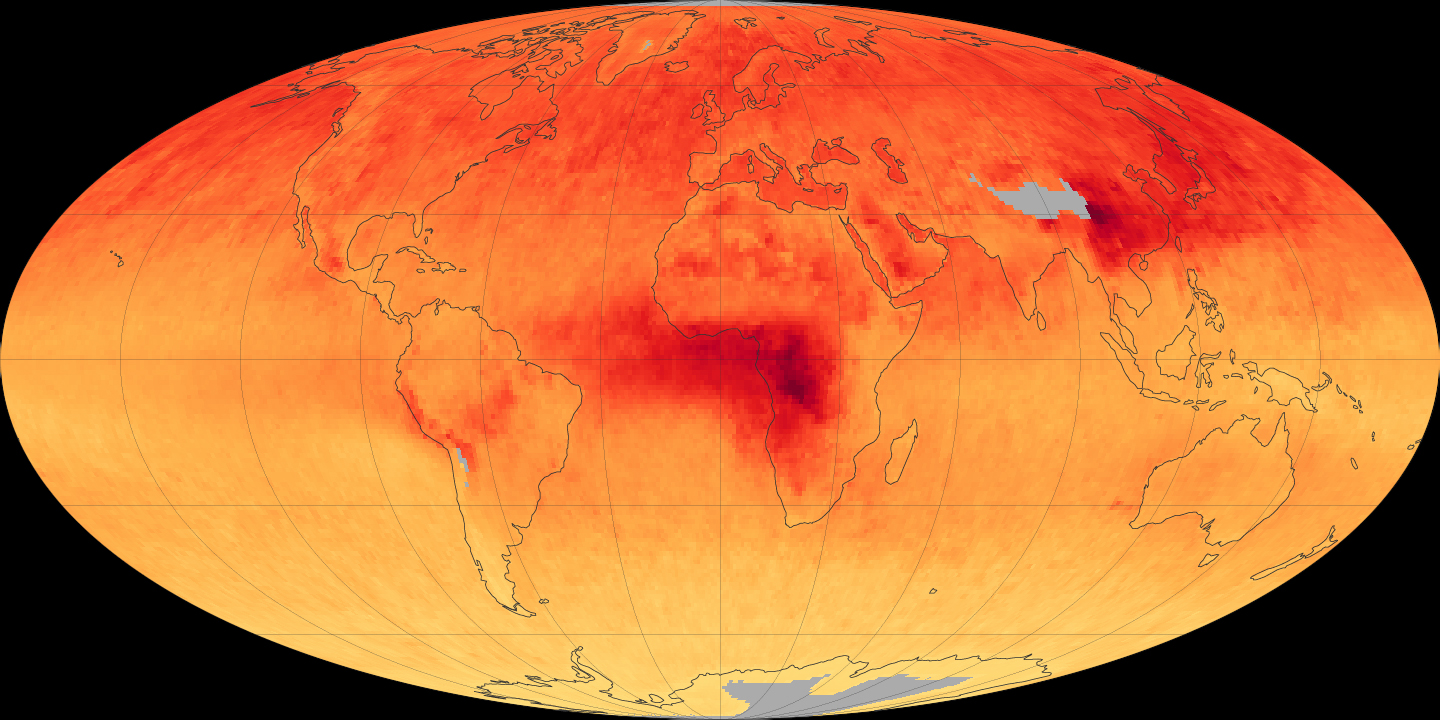
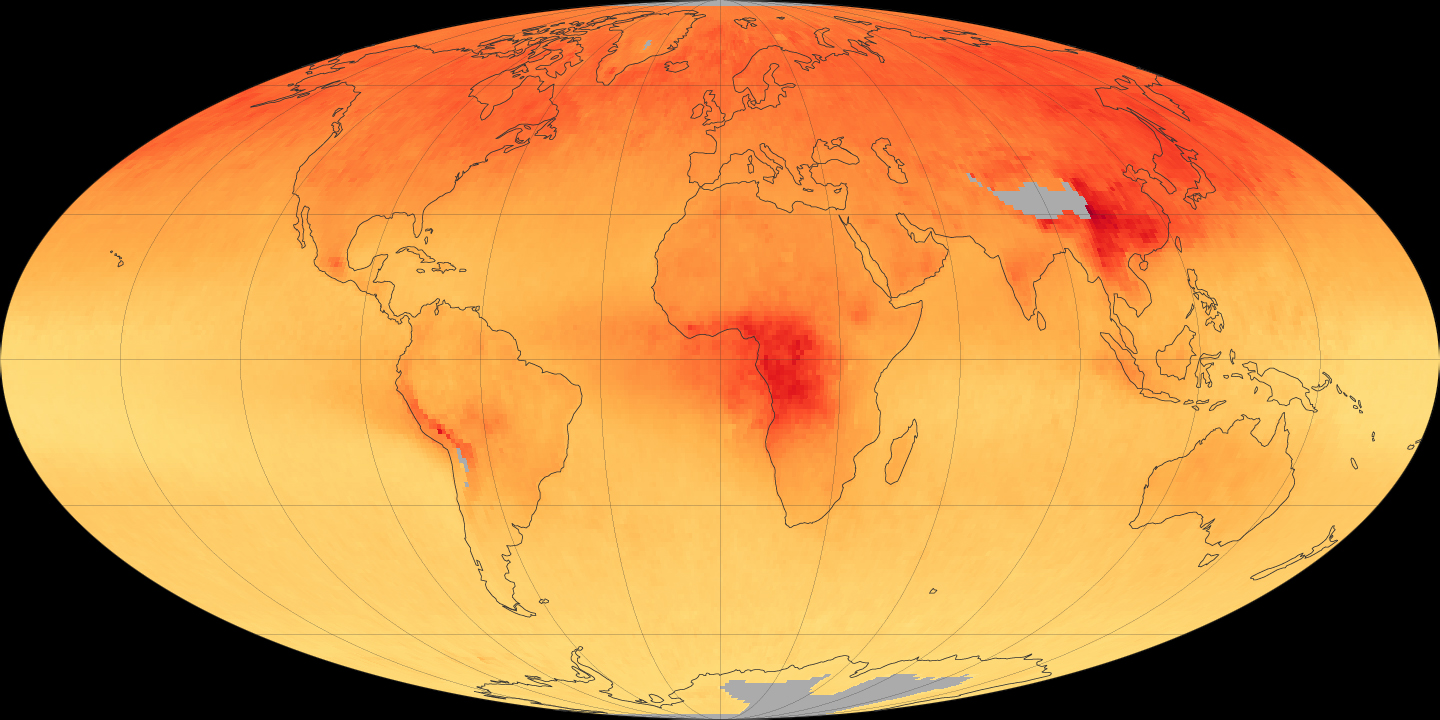
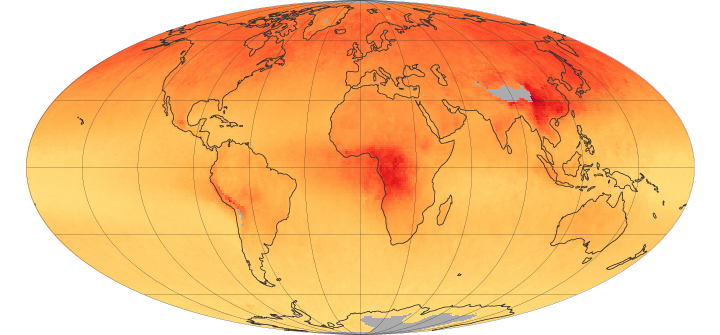
Terra has been in orbit long enough to observe significant changes over time. To illustrate how global carbon monoxide concentrations have changed, maps of the mission’s first (2000) and most recent full year (2014) of data are shown above. The maps depict yearly average concentrations of tropospheric carbon monoxide at an altitude of 3,700 meters (12,000 feet). Concentrations are expressed in parts per billion by volume (ppbv). A concentration of 1 ppbv means that for every billion molecules of gas in a measured volume, one of them is a carbon monoxide molecule. Yellow areas have little or no carbon monoxide, while progressively higher concentrations are shown in orange and red. Places where data was not available are gray. For both years, the data has been averaged, which eliminates seasonal variations.
According to MOPITT, carbon monoxide concentrations have declined since 2000. The decrease is particularly noticeable in the Northern Hemisphere. Most air quality experts attribute the decline to technological and regulatory innovations that mean vehicles and industries are polluting less than they once did. Interestingly, while MOPITT observed slight decreases of carbon monoxide over China and India, satellites and emissions inventories have shown that other pollutants like sulfur dioxide and nitrogen dioxide have risen during the same period.
“For China, nitrogen dioxide emissions are mostly from the power and transportation sectors and have grown significantly since 2000 with the increase in demand for electricity,” explained Helen Worden, an atmospheric scientist from the National Center for Atmospheric Research. “Carbon monoxide emissions, however, have a relatively small contribution (less than 2 percent) from the power sector, so vehicle emissions standards and improved combustion efficiency for newer cars have lowered carbon monoxide in the atmosphere despite the fact that there are more vehicles on the road burning more fossil fuel.”
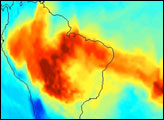
As illustrated by the maps, the news is also generally positive for the Southern Hemisphere, where deforestation and agricultural fires are the primary source of carbon monoxide. In South America, MOPITT observed a slight decrease in carbon monoxide; other satellites have observed decreases in the number of small fires and areas burned, suggesting a decrease in deforestation fires since 2005. Likewise, MOPITT has observed decreases in the amount of carbon monoxide over Africa. “There have been fewer fires in Africa, so that is a big part of the story there,” explained Worden. “However, growing cities might be increasing of the amount of CO in some areas of equatorial Africa.”
The line graph shows the long-term trend as well as monthly variations in carbon monoxide concentrations. While the overall trend is downward, several peaks and valleys are visible. For instance, some researchers attribute the peak from around 2002 to 2003 to an unusually active fire season in the boreal forests of Russia. The dip in carbon monoxide emissions from 2007 to 2009 also matches a decline in global fire emissions. In addition, researchers have noted that this dip overlaps with a global financial crisis that started in late 2008 and caused global manufacturing output to decline.
NASA Earth Observatory images by Jesse Allen and Joshua Stevens, using data from the National Center for Atmospheric Research (NCAR) and the University of Toronto MOPITT Teams. Caption by Adam Voiland, with input from Helen Worden (UCAR), Merritt Deeter (NCAR), and Benjamin Laken.