
As winter drew to a close, California water managers faced bleak prospects. For the fifth consecutive year, high pressure over the Pacific Ocean blocked incoming winter storms, the source of most of California’s water. Rain-fed reservoirs were well below capacity, and the mountain snowpack that typically resupplies reservoirs throughout the summer was dangerously low. It was 1991, and by the end of the summer, San Francisco came within two weeks of running out of water.
Now, the winter of 2014 has ended, and for the third consecutive year, mountain snow is in short supply. As of February 28, the snowpack was 22 percent of normal—insufficient to resupply reservoirs already low after 2013 ended as the driest year on record in parts of California. Though conditions are similar to 1991, this time San Francisco water managers have access to new tools that provide an unprecedented view of the snowpack during the critical spring melt. That tool helped them to navigate 2013 without running out of water, and it may come in handy for 2014 too.
In the spring of 2013, NASA’s Airborne Snow Observatory (ASO) took to the skies for the first time on a Twin Otter aircraft to test out new technology. Using measurements from a lidar instrument and a solar spectrometer, which measures reflected light, Tom Painter, a scientist at NASA’s Jet Propulsion Laboratory, and his colleagues were able to track the amount of water available from snowmelt and melt patterns as the season progressed.
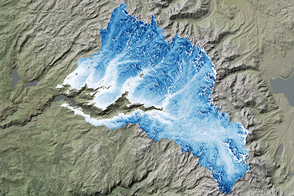
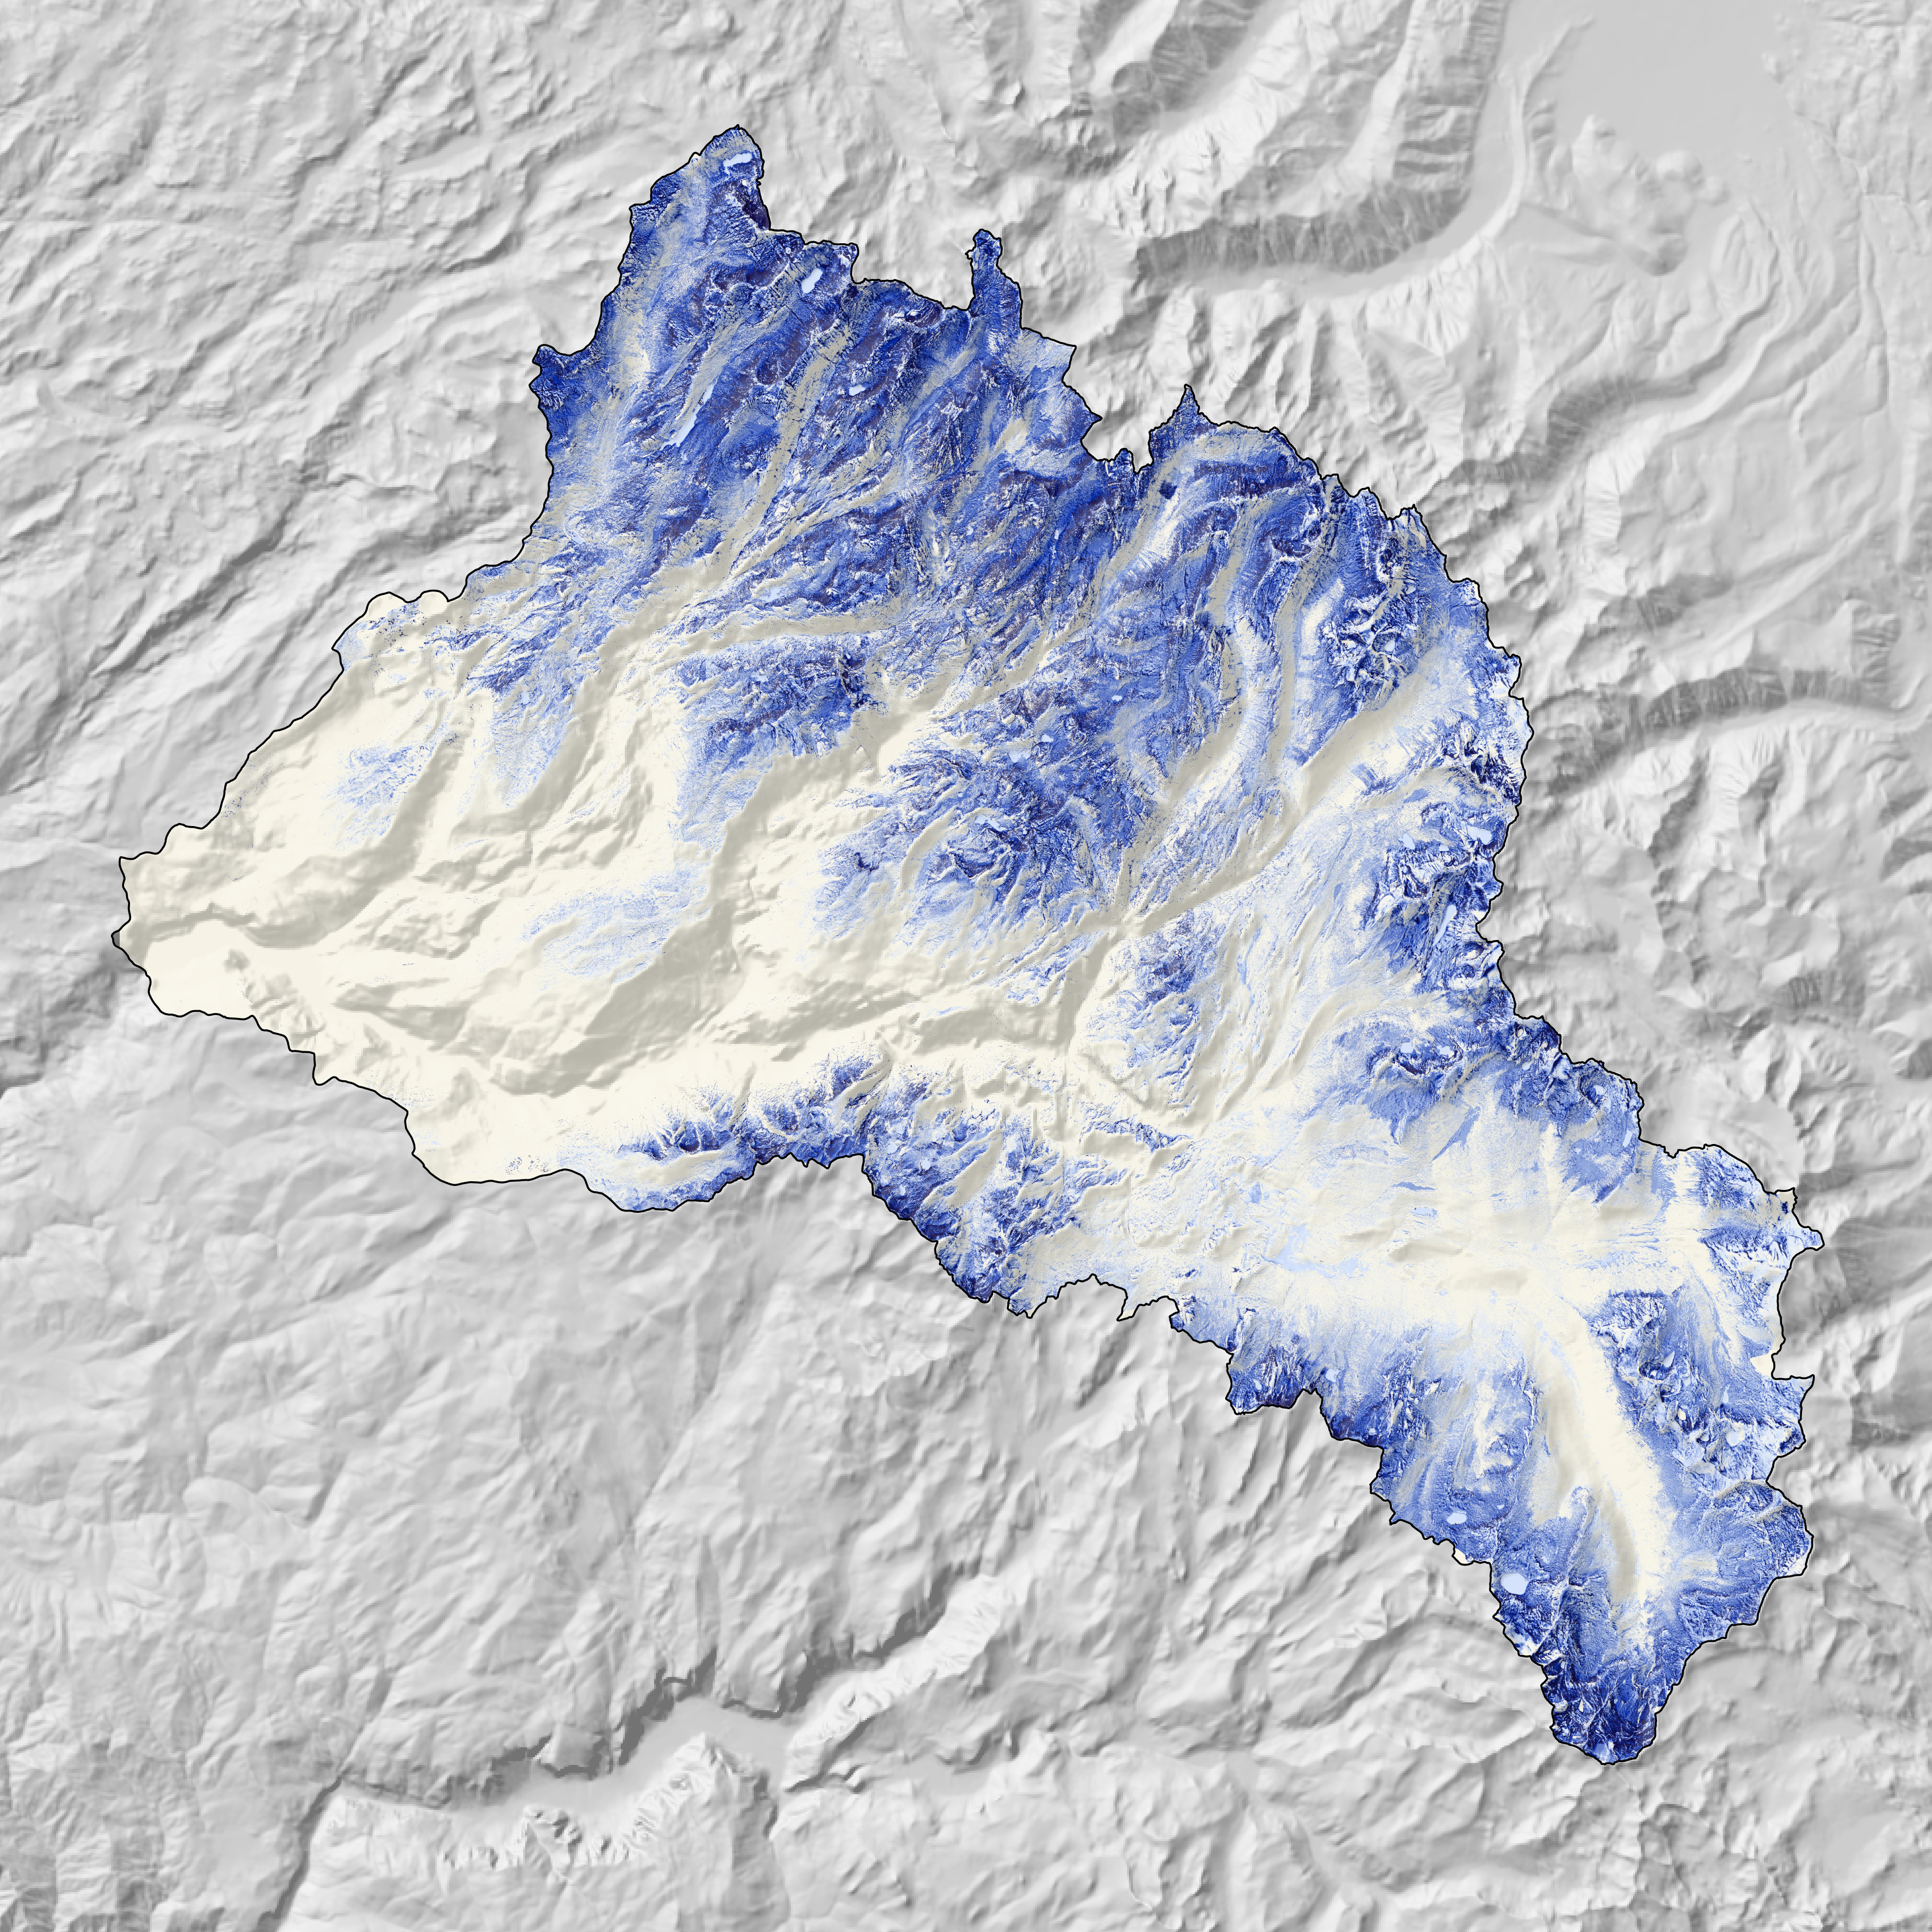
The image above shows a snow water equivalent map of the Upper Tuolumne River watershed—the water supply for San Francisco and other Bay Area cities and industries—from an ASO flight on April 21, 2013. It is a calculation of how much water the snow contained based on snow depth and density. Dark areas indicate the deepest snow and most water. Painter calculated the snow water equivalent by measuring the snow depth using the lidar instrument, which bounces laser off the snow surface to determine its distance from the plane. Subtracting the height of the snow from the height of the bare ground provides an accurate measure of snow depth. Snow density varies in predictable ways, says Painter, and that makes it possible to estimate how much water is available based on the depth measurements.
The measurement is essential for water managers, who need to know how much water is flowing in to the system to balance it with the amount of water being used. Currently, water managers estimate incoming water from melting snow based on snow depth measurements at established monitoring stations (called snow pillows) in the mountains. By necessity, these locations are accessible, not on the top of the mountains. Once the snow melts past these points, water managers are blind, says Bradley Doorn, head of NASA’s water resources program. “Much of snow pack is melting in locations not monitored and at critical times for decision management.”
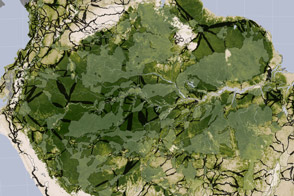
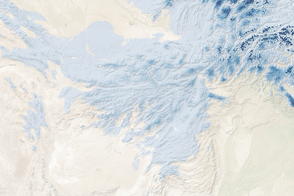
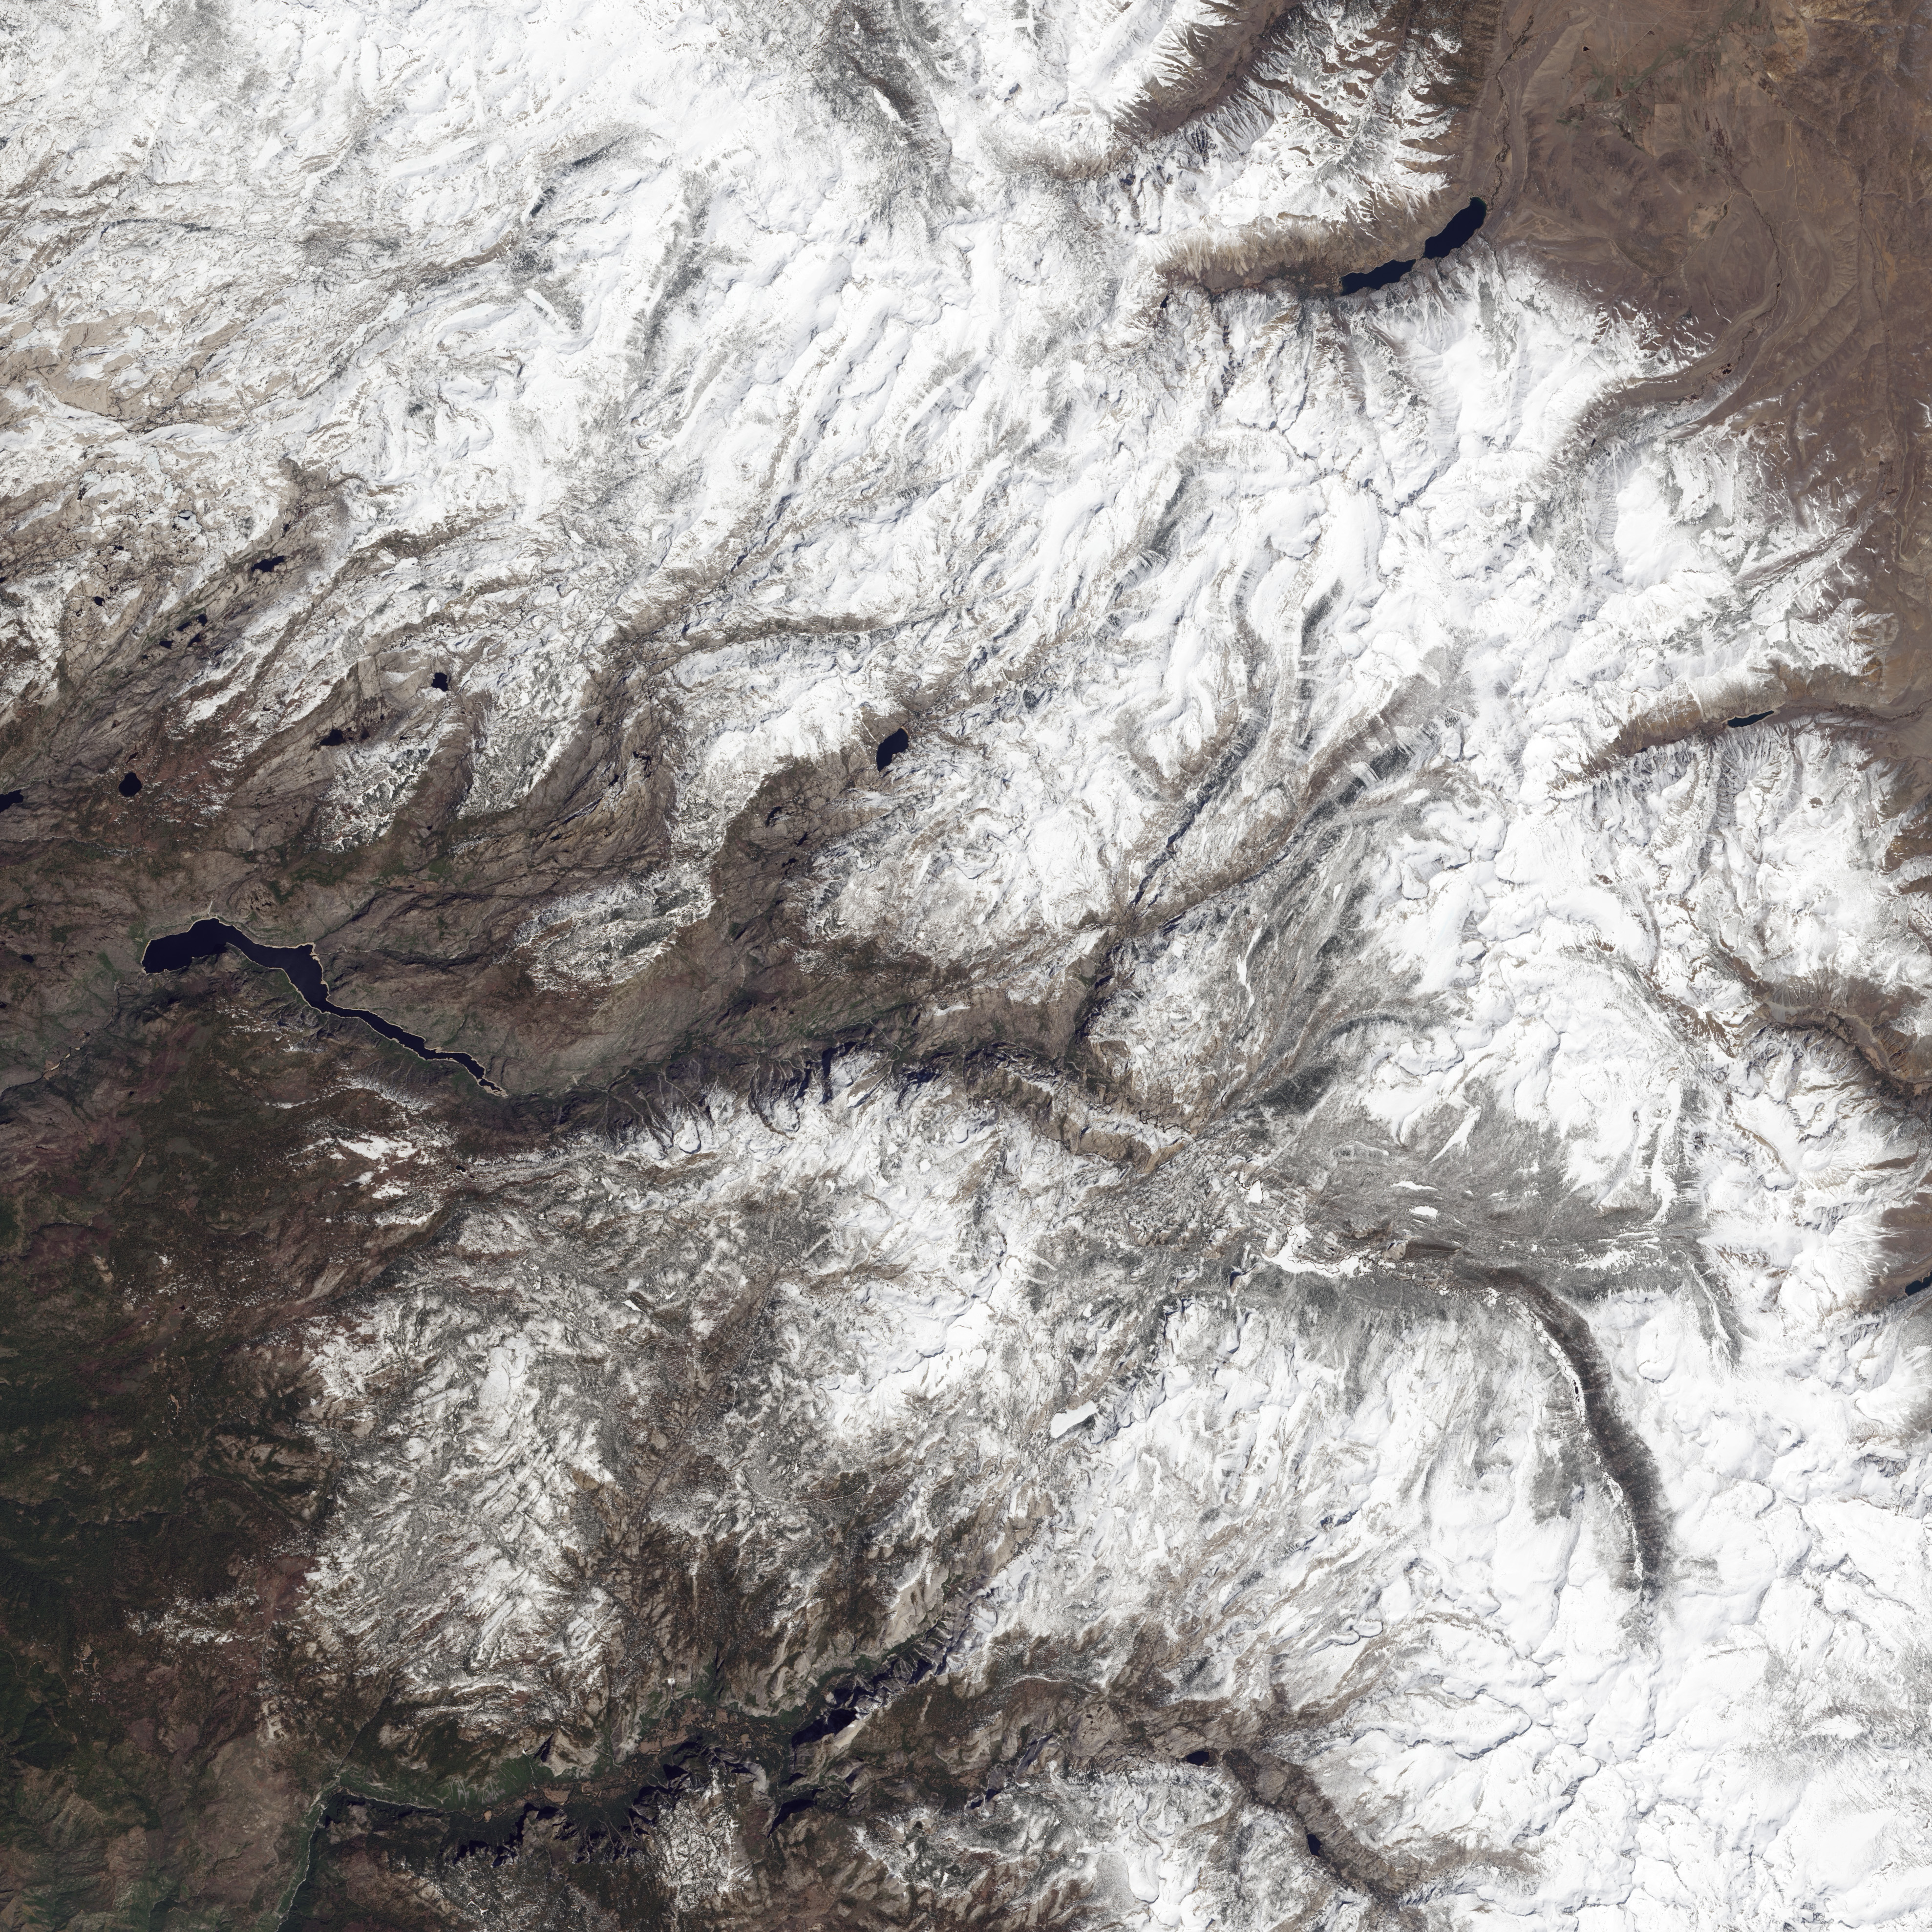
Current satellite technology can provide a rough estimate of snow water equivalent, but it falls short in mountainous regions, where forests, slopes, shadows, and too much snow for the sensors make remote sensing difficult. This image shows the Upper Toulumne River Watershed from the Operational Land Imager on the Landsat 8 satellite at midmorning on April 18, 2013. The snow extent corresponds with the snow water equivalent map, but it’s impossible to gauge depth from this view. The brown ground shows through in areas where snow cover is thin, but the western slopes of the mountains are also dark because they are in shadow.
Water managers now rely on computer models to estimate snow water equivalent based on ground-based snow depth measurements. The models can have forecast errors as high as 40 percent, says Painter. In particular, the models don’t account for snow that has piled up in ravines, an underestimated source of water before the ASO survey. The ASO snow depth measurements and measurements from the ASO spectrometer significantly improved models for the Upper Toulumne River basin. The spectrometer measured the snow’s brightness or albedo. In general, fresh white snow reflects more light and will melt more slowly than older or dirty snow, which absorbs more energy because it is dark. Detailed measurements of albedo help indicate how quickly the snow will melt. (See Dusting the virtues of snow to learn more about Painter’s work studying albedo and snow melt.)
ASO monitoring of the Tuolumne River Basin continues in 2014, in what may shape up to be California’s worst drought on record. Snow pillows are likely to be free of snow much earlier in the year than they have ever been, which means that water managers will be blind to snow amounts much earlier than ever. “It also provides us with the full quantification of snow water equivalent distribution in the most extreme drought on record,” says Painter. “For science, this gives us an unprecedented benchmark against which to understand climate variability and climate change.”
Being able to predict water availability from snowmelt will be valuable, not just in helping California get through its latest drought, but also in providing water worldwide. Some 1.5 billion people worldwide rely on snow melt as a source of fresh water and yet this resource is changing to rain, impacting the availability of water, melt timing of glaciers, and regional climate feedbacks. ASO sets the stage for future mapping of snow water resources at the regional to global scale.
NASA Earth Observatory images by Robert Simmon, using data from Thomas Painter and Landsat data from the U.S. Geological Survey. Caption by Holli Riebeek.