The numbers are staggering and often hard to absorb. Close to 25 million square kilometers (9.65 million square miles) of tropical forest are spread across 75 countries on three continents. The trees in those forests store 225 to 250 billion tons of carbon. Each year, vast tracts of those trees are lost to development and agriculture—about 90,000 square kilometers (35,000 square miles) annually from 2000 to 2012. This deforestation releases nearly a billion tons of carbon dioxide into the air, between 15 to 20 percent of global emissions.
For a decade, conservation groups and governments have been working to slow the destruction of tropical forests and curb the increase of carbon in the atmosphere. Through a United Nations program called Reducing Emissions from Deforestation and Forest Degradation (REDD+), negotiators strive to offset carbon emissions by industrialized nations and preserve forests in developing nations. Recently, a trio of scientists from the Woods Hole Research Center (WHRC) added a new angle to the discussion. Why not preserve biodiversity and promote environmental sustainability at the same time?
Patrick Jantz, Scott Goetz, and Nadine Laporte of WHRC combined satellite data, ground-based surveys, and socioeconomic data to map a new way forward for tropical conservation. Tropical forests are believed to be home to as much as half of the world’s terrestrial species. They also contain some of the densest stocks of carbon, so a little bit of well-thought-out conservation can go a long way.
Their idea is to link existing forest and biosphere preserves with strategic corridors of densely vegetated (and carbon-rich) protected land. Emerging research suggests that even narrow corridors of undeveloped woodlands help the reproduction, genetic diversity, and survival of plant and animal species. Protected corridors also offer a safety valve for species that must move and adapt to climate change.
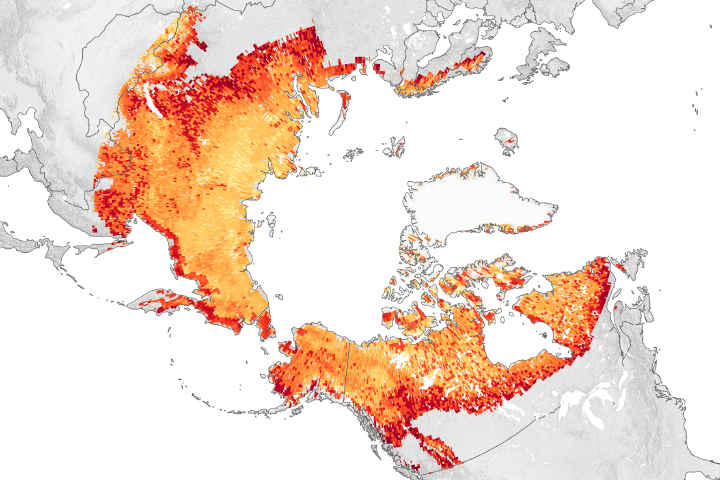
The map, created from WHRC data, shows the Amazon forests of South America. Black lines represent the carbon-rich corridors proposed by Jantz and colleagues. Areas with lighter shading depict existing protected areas, while darker colors are lands that are unprotected and potentially open for development.
To create the corridors, Jantz started with a tropical carbon map that Goetz, Laporte, Alessandro Baccini, and other WHRC scientists developed a few years ago. That map included data from NASA’s ICESat, Terra, and Aqua satellites, Japan’s ALOS satellite, the Shuttle Radar Topography Mission, and from thousands of ground-based observations. The tropical carbon map became the base layer on the map above.
Jantz and colleagues overlaid that carbon map with the boundaries of protected areas in each tropical nation. They then looked for map pixels with the highest biomass (average density of trees and other vegetation) between each preserve. At the same time, they examined the threats to and socioeconomic costs of preserving tropical forests from competing uses such as farming and development. One of the tools was a NASA-sponsored data project known as the Human Influence Index, which considers how proximity to road and navigable rivers, human settlements, and other infrastructure affect ecosystems. The goal was to find corridors that could balance economic opportunities in developing nations with the need to preserve forest. These map layers helped Jantz identify potential corridors for protection.
Mapping the corridors didn't end with accounting for the trees. Looking more closely at the Amazon forest, Jantz looked at how abundant and diverse each stretch of land is and how important that stretch is to the resident species. “Maintaining connectivity of forest ecosystems provides ecological and societal benefits,” he said. “Corridors can help ensure long-term species survival, provide room for ecosystems to reorganize in response to climate change, and protect ecosystem resources that people depend on.”
After taking trees, plants, animals, and human needs into account, they mapped 16,257 corridors between 5,600 protected areas. Each forest corridor is at least one to two kilometers wide, but the shapes are not necessarily straight lines. In some cases, the path was diverted to pick up more biomass or more biodiversity. Jantz and colleagues found that all of their narrows swaths of forest added up to 3.4 million square kilometers of land containing nearly 51 billion tons of carbon—15 percent of the total unprotected carbon stored in vegetation in the tropics.
Writing a perspectives piece on the carbon corridors for Nature Climate Change, Oscar Venter of James Cook University noted: “To focus on corridors, as suggested by Jantz and colleagues, seems a promising solution. Corridors often yield benefits to biodiversity disproportionate to their size, by increasing population connectivity and providing safe routes for species to move with a changing climate, and could therefore offer a uniquely efficient way of increasing the biodiversity benefits of REDD+.”
To view and download the carbon corridors maps, visit the WHRC web site.
NASA Earth Observatory image by Robert Simmon, using data from Patrick Jantz and Alessandro Baccini at Woods Hole Research Center. Caption by Mike Carlowicz.