

Because they grow year-round, tropical forests are believed to be the most productive on Earth. The thick stands of trees around the mid-section of Earth store vast amounts of carbon in their wood and roots, but scientists have only been able to make broad, speculative estimates about just how much. That is changing.
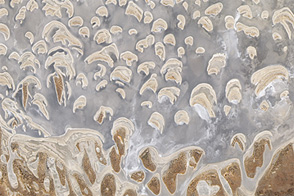
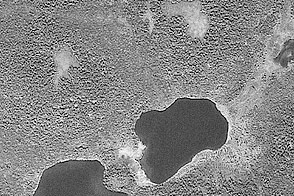
The top map above shows the total carbon stored in tree biomass in New Guinea, a heavily forested island just north of Australia. The second map shows the degree of uncertainty about those measurements based on geographic location. Areas where biomass is relatively well known are shown in green, while more uncertain measurements are orange and red.
Both maps were built from data analyzed by Sassan Saatchi of NASA's Jet Propulsion Laboratory and 14 colleagues from ten institutions. The team compiled data from five space-based instruments—the GLAS lidar on ICESat; the Moderate Resolution Imaging Spectroradiometer (MODIS) on the Terra and Aqua satellites; the QuikSCAT scatterometer; and the Shuttle Radar Topography Mission—and from 4,079 ground-based forest plots.
They mapped more than three million measurements of tree heights and correlated them to measurements of trees from the ground. They calculated the amount of carbon stored above ground and in the roots. And they extrapolated their results over forest areas where there is less ground sampling but some known characteristics. The result was a benchmark map of biomass carbon stocks covering 2.5 billion hectares (9.65 million square miles) of forest in 75 countries on three continents. It was published in 2011 in the Proceedings of the National Academy of Sciences.
Though previous efforts have mapped tropical forests on regional or local scales, the new map was “the first to quantify the distribution of forest carbon systematically over the entire tropical region,” Saatchi says. “In the northern forests of the United States, Canada, and Europe, there are usually sophisticated forestry systems to measure structure and biomass by state or region. In the tropics, we often had no clue how forest carbon is distributed on a local level.”
Saatchi is most proud that the map not only assesses carbon stocks, but also gives a picture of the quality and certainty of the assessment. Knowing something about the error bars is important for building confidence with resource managers and economists who are trying to calculate the needs and values of forests. It is also important for pointing researchers to the areas where more work is needed.
Read more about Saatchi’s work and that of other researchers measuring global forests and carbon in our new feature story: Seeing Forests for the Trees and the Carbon: 
Mapping the World’s Forests in Three Dimensions.
NASA Earth Observatory map by Robert Simmon, using data from the NASA Jet Propulsion Laboratory Tropical Forest Mapping Project. Caption by Michael Carlowicz.