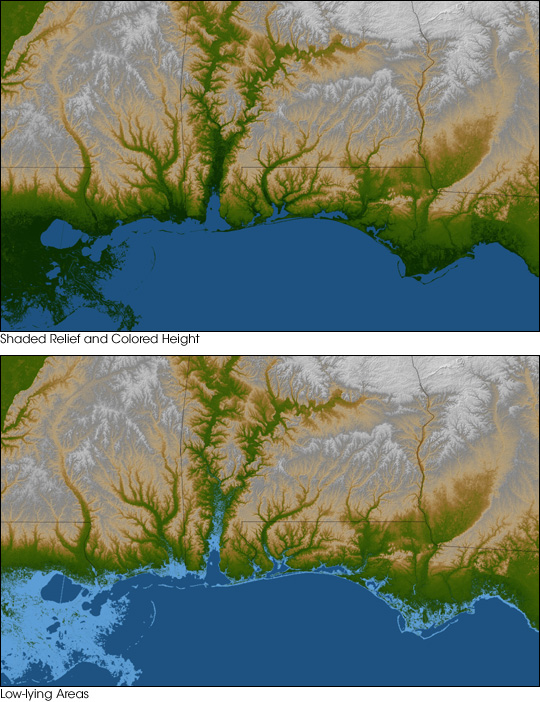
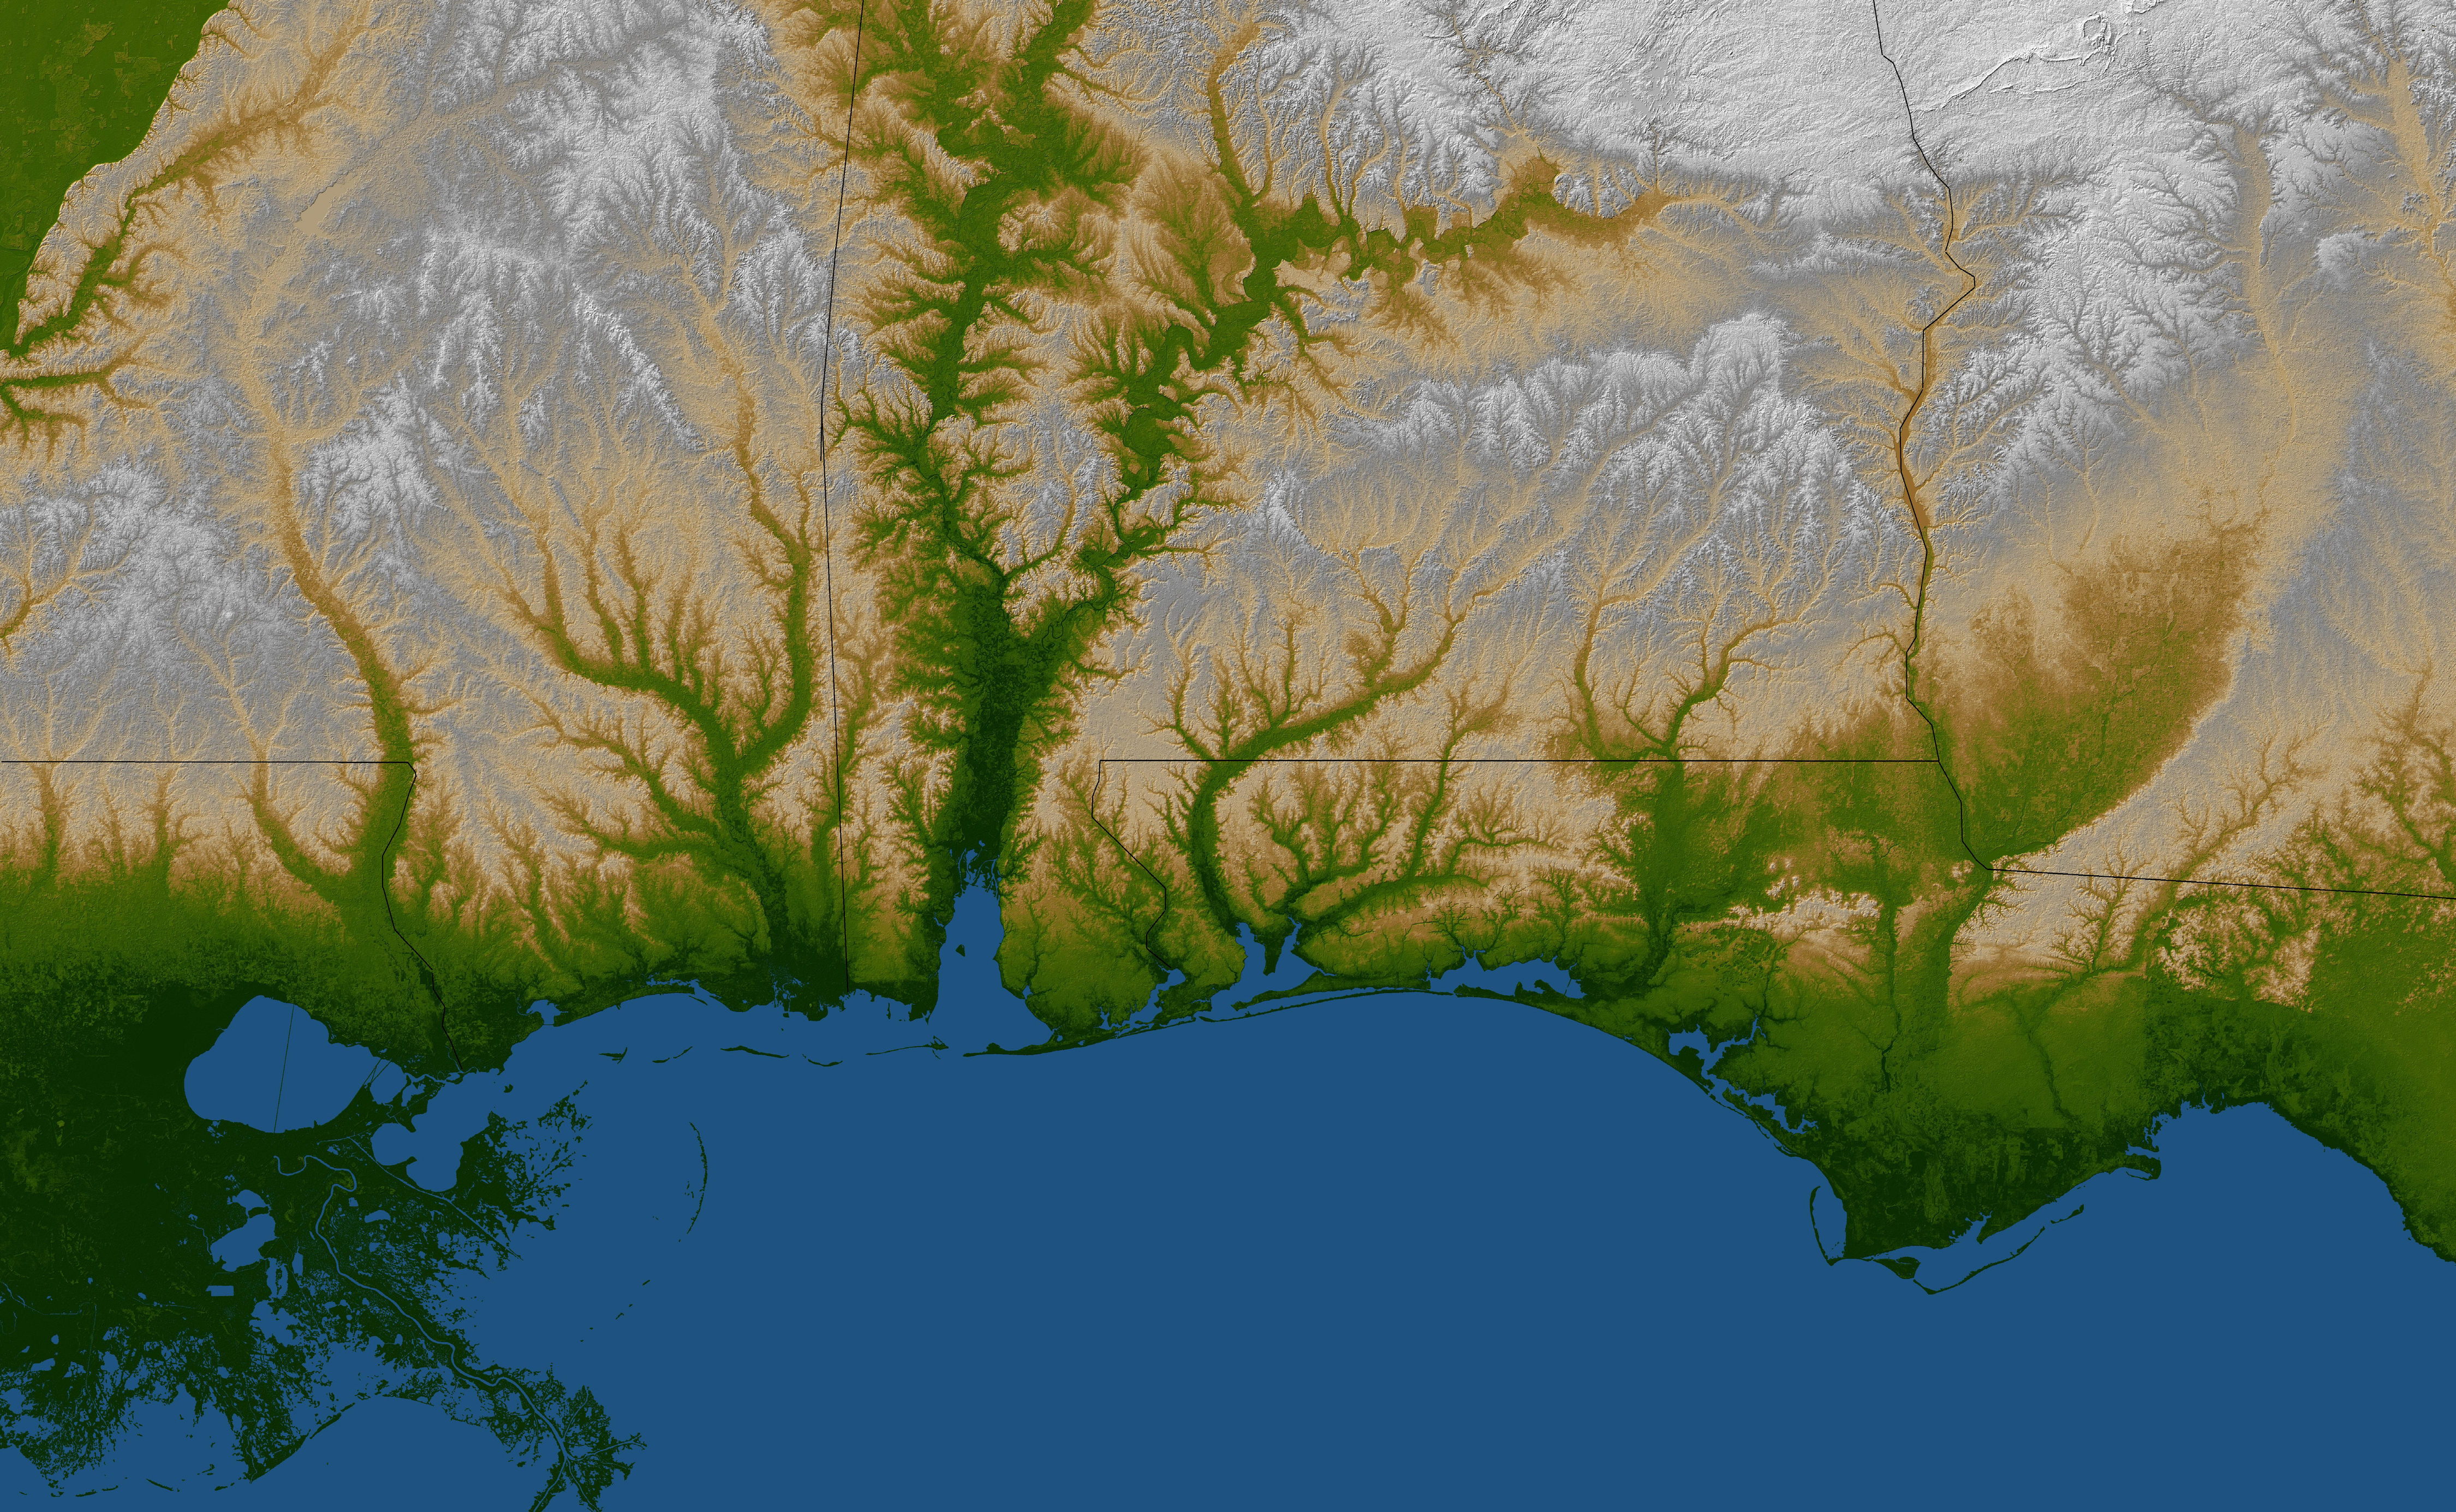
The topography of the Gulf Coast states is shown in this color-coded shaded relief map generated using data collected by NASA’s Shuttle Radar Topography Mission (SRTM). The image on the top is a standard view showing southern Louisiana, Mississippi, Alabama, and the panhandle of Florida. Green colors indicate low elevations, rising through yellow and tan, to white at the highest elevations.
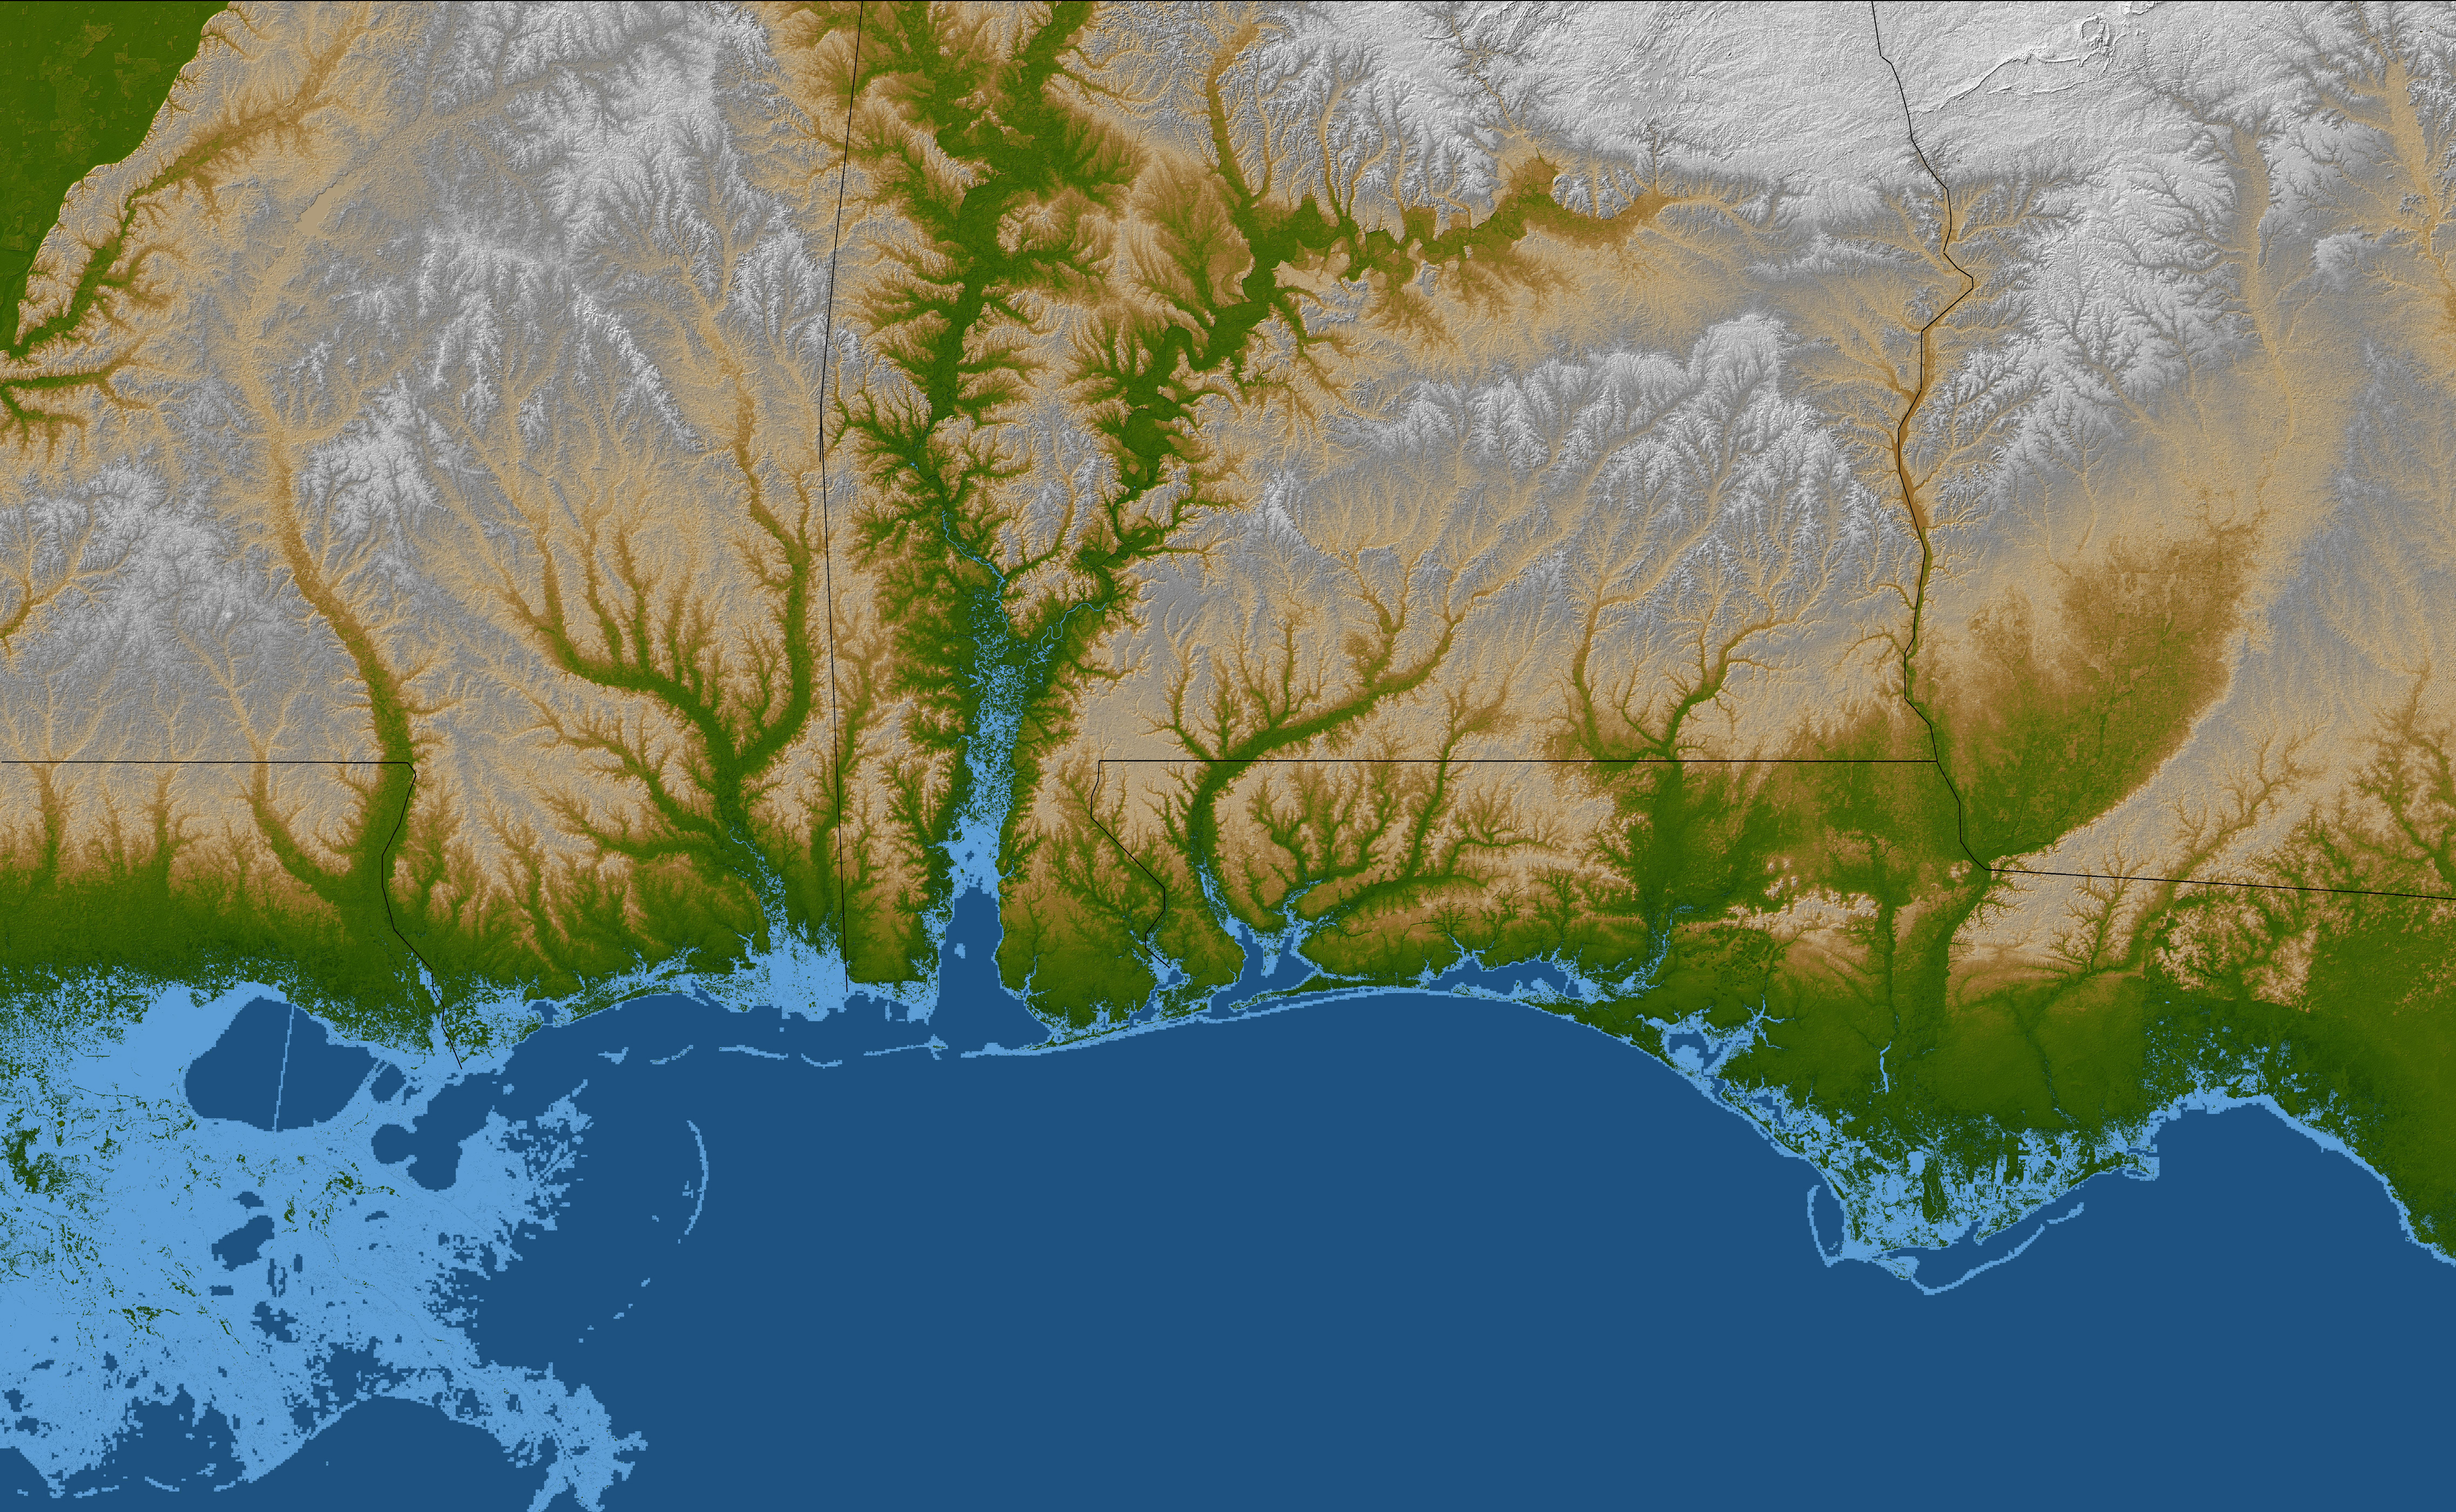
For the view on the bottom, elevations below 10 meters (33 feet) above sea level have been colored light blue. These low coastal elevations are especially vulnerable to flooding associated with storm surges such as occurred when Hurricane Ivan made landfall. Planners can use data like these to predict which areas are in the most danger as well as help develop mitigation plans in the event of flooding.
The elevation data used to make this image were acquired by the Shuttle Radar Topography Mission aboard the Space Shuttle Endeavour, launched on Feb. 11, 2000. SRTM used the same radar instrument that comprised the Spaceborne Imaging Radar-C/X-Band Synthetic Aperture Radar (SIR-C/X-SAR) that flew twice on the Space Shuttle Endeavour in 1994. SRTM was designed to collect 3-D measurements of the Earth’s surface. To collect the 3-D data, engineers added a 60-meter (approximately 200-foot) mast, installed additional C-band and X-band antennas, and improved tracking and navigation devices. The mission is a cooperative project between NASA, the National Geospatial-Intelligence Agency (NGA) of the U.S. Department of Defense and the German and Italian space agencies. It is managed by NASA’s Jet Propulsion Laboratory, Pasadena, Calif., for NASA’s Science Mission Directorate, Washington, D.C.
The topography of the Gulf Coast states is shown in this color-coded shaded relief map generated using data collected by NASA’s Shuttle Radar Topography Mission (SRTM). The image on the top is a standard view showing southern Louisiana, Mississippi, Alabama, and the panhandle of Florida. Green colors indicate low elevations, rising through yellow and tan, to white at the highest elevations.
For the view on the bottom, elevations below 10 meters (33 feet) above sea level have been colored light blue. These low coastal elevations are especially vulnerable to flooding associated with storm surges such as occurred when Hurricane Ivan made landfall. Planners can use data like these to predict which areas are in the most danger as well as help develop mitigation plans in the event of flooding.
The elevation data used to make this image were acquired by the Shuttle Radar Topography Mission aboard the Space Shuttle Endeavour, launched on Feb. 11, 2000. SRTM used the same radar instrument that comprised the Spaceborne Imaging Radar-C/X-Band Synthetic Aperture Radar (SIR-C/X-SAR) that flew twice on the Space Shuttle Endeavour in 1994. SRTM was designed to collect 3-D measurements of the Earth’s surface. To collect the 3-D data, engineers added a 60-meter (approximately 200-foot) mast, installed additional C-band and X-band antennas, and improved tracking and navigation devices. The mission is a cooperative project between NASA, the National Geospatial-Intelligence Agency (NGA) of the U.S. Department of Defense and the German and Italian space agencies. It is managed by NASA’s Jet Propulsion Laboratory, Pasadena, Calif., for NASA’s Science Mission Directorate, Washington, D.C.
NASA image courtesy SRTM Team, NASA/JPL/NGA


