Dating back to A.D. 870, intermittent records assembled by the Vikings record the number of weeks per year that ice occurred along the north coast of Iceland. Other, scattered records of Arctic sea ice date back to the mid-1700s, when sailors kept notes on Northern Hemisphere shipping lanes. Global air temperature records date back to the 1880s and can offer a stand-in (proxy) for Arctic sea ice conditions; but such temperature records were initially collected at just 11 locations. Russia’s Arctic and Antarctic Research Institute has compiled ice charts since 1933.
Today, scientists studying Arctic sea ice trends can rely on a fairly comprehensive record dating back to 1953. They use a combination of satellite records, shipping records, and ice charts from several countries.
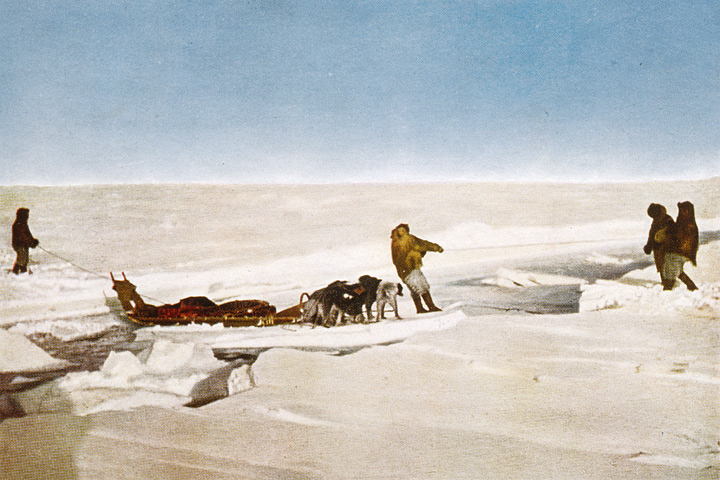
Early records of sea ice cover come from explorers like Robert Peary, who attempted to reach the North Pole in 1909. But expeditions were sporadic and only surveyed their immediate environment, so their records are far from comprehensive. (Image courtesy Library of Congress Prints and Photographs Division.)
In the Antarctic, data prior to the satellite era are even more sparse. To extend the historical record of Southern Hemisphere sea ice back in time, scientists have been investigating two types of proxies. One reference is the records kept by Antarctic whalers since the 1930s, which document the location of all whales caught. Because whales tend to congregate and feed near the sea ice edge, their locations could be a proxy for ice extent.
A second proxy is the detection of phytoplankton-derived organic compounds in Antarctic ice cores. Since phytoplankton grow most abundantly along the edges of the ice, the concentration of sulfur-containing compounds has been proposed as an indicator of how far the ice edge extended from the continent. Currently, only the satellite record is considered sufficiently reliable for studying Antarctic sea ice trends.
Since 1979, a collection of satellites has provided a continuous, nearly complete record of Earth’s sea ice cover. Valuable data are collected by satellite sensors that observe the microwaves emitted by the ice surface. Unlike visible light, the microwave energy radiated by ice passes through clouds. This means it can be measured year-round, even through the long polar night.
The continuous sea ice record began with the Scanning Multichannel Microwave Radiometer (SMMR) on the Nimbus-7 satellite (1978-1987) and continued with the Special Sensor Microwave/Imager (SSM/I) and the Special Sensor Microwave Imager Sounder (SSMIS) on Defense Meteorological Satellite Program (DMSP) satellites (1987 to present). The Advanced Microwave Scanning Radiometer–for EOS (AMSR-E) on NASA’s Aqua satellite also contributed data (2002-2011), a record that was extended with the 2012 launch of the Advanced Microwave Scanning Radiometer 2 (AMSR2) on JAXA’s GCOM-W1 satellite.
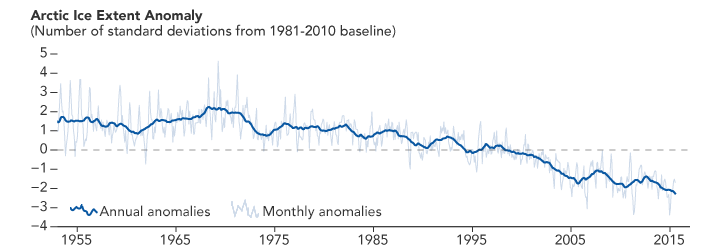
Reliable records of Arctic sea ice began in 1953, and satellites have offered a near-continuous record since 1979. The plot above shows sea ice anomalies—how much Arctic sea ice cover was above or below the norm. (NASA Earth Observatory graph by Joshua Stevens, using NSIDC data provided by Walt Meier/NASA Goddard.)
Because ocean water emits microwaves differently than sea ice, ice “looks” different to a satellite sensor. These observations are processed into digital picture elements, or pixels, with each representing a square of 25 kilometers by 25 kilometers. Scientists estimate the amount of sea ice in each pixel.
There are two ways to express Earth's total polar ice cover: ice area and ice extent. To estimate area, scientists calculate the percentage of sea ice in each pixel, multiply by the pixel area, and add up the amounts. To estimate ice extent, scientists set a threshold percentage, and count every pixel that meets or exceeds that threshold as “ice-covered.” The National Snow and Ice Data Center, one of NASA’s Distributed Active Archive Centers, monitors sea ice extent using a threshold of 15 percent.
The threshold–based approach may seem less accurate, but it has the advantage of being more consistent. When scientists are analyzing satellite data, it is easier to say whether there is or isn’t at least 15 percent ice cover in a pixel than it is to say, for example, whether the ice cover is 70 percent or 75 percent. By reducing the uncertainty in the amount of ice, scientists can be more certain that changes over time are real.
Beyond measuring ice coverage, satellites can also help scientists get a better handle on thickness. In 2010, the European Space Agency launched the CryoSat-2 satellite, which carries the Synthetic Aperture Interferometric Radar Altimeter (SIRAL). Data from this instrument are converted into maps of sea ice thickness—a useful tool for tracking change over time and for monitoring winter season ice growth.
Researchers also monitor sea ice using aircraft. In the summer of 2016, for example, NASA’s Operation IceBridge mapped the extent, frequency, and depth of melt ponds that form on top of the sea ice during the melt season. The number of melt ponds that form early in the season can affect the minimum extent reached by sea ice in September. Operation IceBridge has monitored sea ice during late winter since 2009.
