New Teams, New Ideas |
|||
In summer of 2000, Jeff Key was settling in to his new job leading a polar remote sensing group at CIMSS, an organization that brings together scientists from the University of Madison-Wisconsin, NASA, and the National Oceanic and Atmospheric Administration (NOAA). In July, a senior colleague suggested to Key that one of the sensors flying on NASA’s new Terra satellite was capturing detailed imagery of the polar regions on a regular enough basis to be able to estimate wind speed and direction by how far clouds and water vapor features moved between one overpass of the satellite and the next. “I was new with NOAA at the time, and my experience was not really with winds,” says Key, “but we did have someone, Chris Velden, who had extensive experience with estimating winds from geostationary satellites. So we thought, ‘Why not give it a try?’” |
|||
 | |||
The group began collecting imagery from a sensor known as MODIS, short for Moderate Resolution Imaging Spectroradiometer. Terra takes about 100 minutes to make the trip from the North Pole, around the Earth, and back, explains Key. “That means we are looking at images captured more than an hour and a half apart.” To calculate winds, they have to be able to see some movement of the clouds between one image and the next, but if too much time elapses, the clouds might not be recognizable any more. “If you go outside and watch clouds in your yard, you can see how fast they can change in minutes. In a one-and-half-hour period clouds can move and change shape a lot. The first thing we had to figure out then was if we could recognize a cloud feature from one image in an image captured 100 minutes later.” |
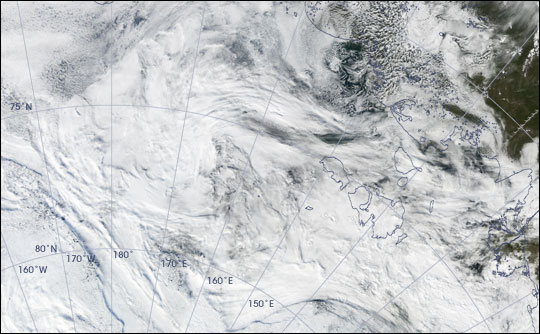
The Moderate Resolution Imaging Spectroradiometer (MODIS) instruments aboard the Terra and Aqua satellites each pass near the North Pole every 100 minutes. This true-color image from August 27, 2003, shows swirls of cloud over the Arctic Ocean. (NASA image by Jesse Allen, based on MODIS data) | ||
“We did some manual tracking—just pulling images up on the computer and picking out features that we would map changes in. Even with 100 minutes between scenes, we found features that we could follow across several images,” says Key. Based on Velden’s past experience estimating winds from geostationary satellite observations, Key, Velden, and Dave Santek, another CIMSS scientist, developed a similar approach for the Terra MODIS images. Santek modified the existing software that automatically finds and tracks important cloud and water vapor features in geostationary satellite image sequences for use with successive orbits of the polar-orbiting Terra satellite. After about nine months of development, says Key, they had an automated process running 24 hours a day at CIMSS. Every five minutes, their computer in Wisconsin reaches out over the Internet and connects with a NOAA computer housed at NASA’s Goddard Space Flight Center in Greenbelt, Maryland, to check for new MODIS data. Once the computer has three images from successive orbits it begins inter-comparing them, identifying cloud and water vapor features and mapping their movement. The program churns out thousands of wind vectors—height, speed, and direction—for each MODIS image. “At first we were just using Terra MODIS data, but in November 2002, we picked up Aqua MODIS data as well. Since the two satellites have staggered orbits, we get imagery from a much more complete area. Plus, using both satellites reduces the time between observations from 100 minutes to just minutes or tens of minutes.” |
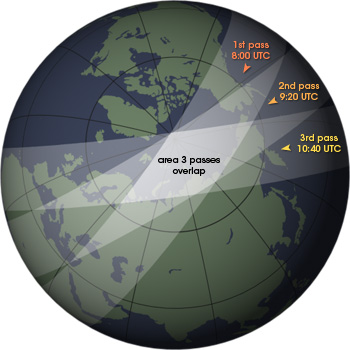
Polar-orbiting satellites circle the Earth while the planet turns beneath them. The illustration at left shows the ground area observed by MODIS aboard Terra on three consecutive overpasses. Near the Pole, the orbits overlap every 100 minutes or so. Computer analysis of the data in areas where at least three consecutive images coincide reveals wind speed and direction. (NASA illustration by Robert Simmon) | 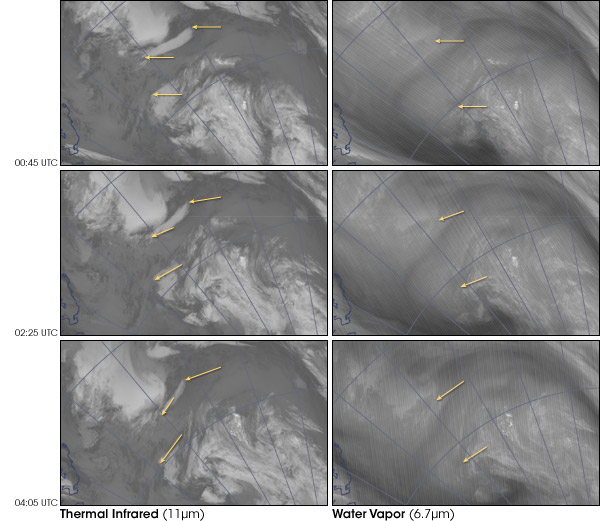 |
|
Key and his group are focused on time because the people who need observations of polar wind need it, well, now, explains Key. “We provide the MODIS polar winds to weather modelers all over the world. A number of those centers tell us they need winds that are no more than 3 hours old, which is quite a challenge when you are talking about information that is derived from satellites like Terra or Aqua that were designed for research rather than real-time, operational use.” Among the first users of the MODIS wind data was the European Centre for Medium-range Weather Forecasts, located in the United Kingdom. It was a time of new beginnings at ECMWF, too. Atmospheric scientist Jean-Noel Thépaut had just taken over the lead role of the group that integrated satellite data sets into the center’s forecast models, and fellow scientist Niels Bormann had just joined the team as well. “We need these partnerships with modelers,” says Key, “to gauge the quality of the products. The best validation of our work is if the winds have a positive impact on forecasts, but that isn’t something we can determine ourselves. That’s why we need the NWP [Numerical Weather Prediction] centers.” “There is a long history of collaboration between CIMSS and ECMWF,” adds Thépaut, “This project, though, started informally. I had just arrived as the new head of the satellite group, and Niels was new as well. We went to visit CIMSS, just to introduce ourselves and to get contacts, and they [the MODIS winds group] said, ‘Hey, do you want to try this new polar winds product?’ And we said, ‘Sure, we’ll give it a try.’ But I think it is fair to say we didn’t have very high hopes.”
|
Thermal infrared (left) and water vapor (right) data reveal structure in the atmosphere and provide estimates of winds. The arrows in these images point to features that can be tracked from one orbit to another (vertical sequence). The changing position of the arrowheads follows the changing location of the cloud. (NASA images by Robert Simmon and Jesse Allen, based on MODIS data) | ||
